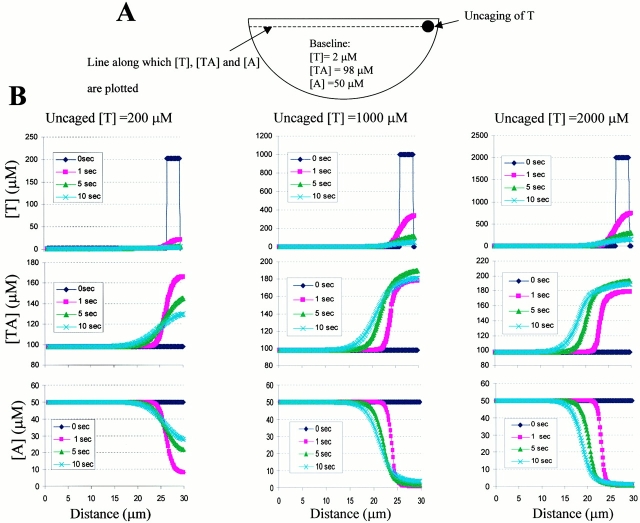
Figure 2.
(A) Schematic representation of the model of keratocyte simulating the uncaging of Tβ4. (B) Virtual Cell simulation data of time-dependent concentration profiles of [T], [TA], and [A] along the line scan through the cell (as depicted in A) for different concentrations of uncaged Tβ4 (left, 200 μM; middle, 1,000 μM; right, 2,000 μM). The uncaged Tβ4 is indicated as a 3-μm-wide spike in the [T] curve at time t = 0. Note that although a minor component of photoreleased Tβ4 diffuses rapidly, resulting in [T] decreasing to its baseline value, much of Tβ4 rapidly binds to the neighboring actin monomers and diffuses slowly as shown by the localization of [TA] at a high concentration around the photoactivated region. Concomitantly, a dramatic decrease in the free G-actin concentration takes place.

