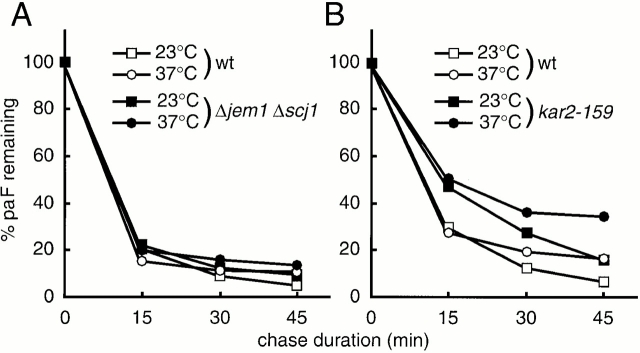
Figure 4.
In vivo ERAD analysis of pαF. (A) Wild-type (SEY6210, wt) and Δjem1 Δscj1 (SNY1026-7A, Δjem1 Δscj1) cells were pulse labeled with 35S–amino acids at 23°C for 10 min in the presence of 10 μg/ml tunicamycin, and chased for the indicated times at either 23 or 37°C. pαF was recovered from cell extracts by immunoprecipitation using an anti-ppαF antiserum and analyzed by SDS-PAGE. Relative amounts of pαF were quantified by radioimaging and the means of two independent experiments are shown. The amount of pαF at 0 min chase was set to 100%. □, wild-type chased at 23°C; ○, wild-type chased at 37°C; ▪, Δjem1 Δscj1 chased at 23°C; •, Δjem1 Δscj1 chased at 37°C. (B) kar2-159 (RSY579, kar2-159) and wild-type (SNY1084-1D, wt) cells were pulse labeled with 35S–amino acids for 10 min at 23°C in the presence of 10 μg/ml tunicamycin, and were chased for the times indicated at 23 or 37°C. Degradation of pαF was followed as in A. ▪, kar2-159 chased at 23°C; •, kar2-159 chased at 37°C; □, wild-type chased at 23°C; ○, wild-type chased at 37°C.

