Figure 5.

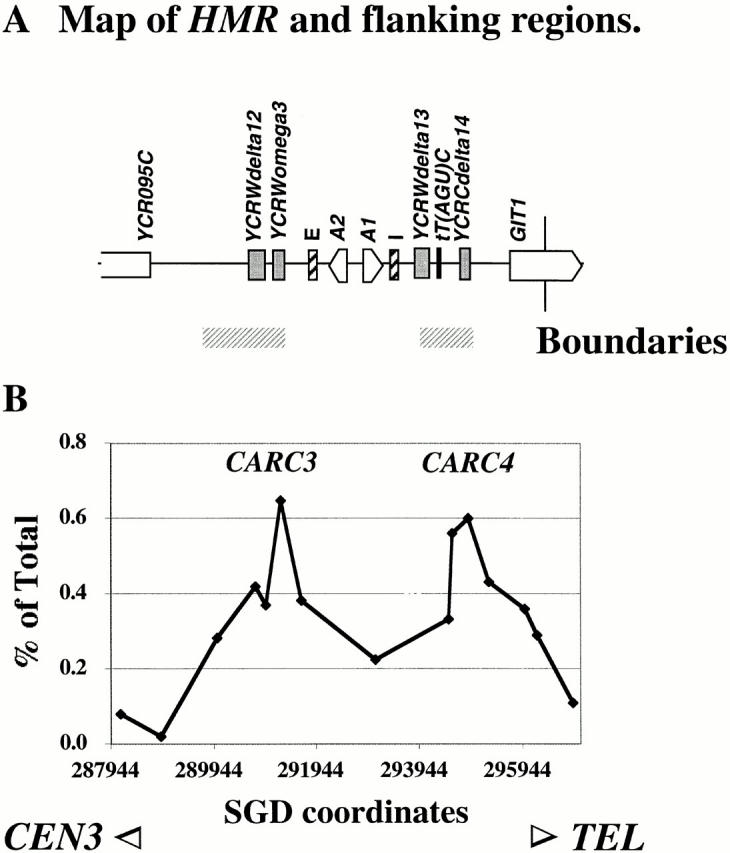
Association of HMR boundary elements with Mcd1p. (A) Map of HMR showing ORFs, silencers (I and E), and other sequence features. Previously mapped locations of the genetically defined boundaries are shown by horizontal gray bars below the map. (B) Quantification of Mcd1p binding to HMR and boundaries in mitotic cells. The amount of immunoprecipitated DNA (as percent of total) is plotted on the y axis versus DNA sequence coordinates on the x axis. The DNA sequence coordinates are aligned to the physical map in A.
