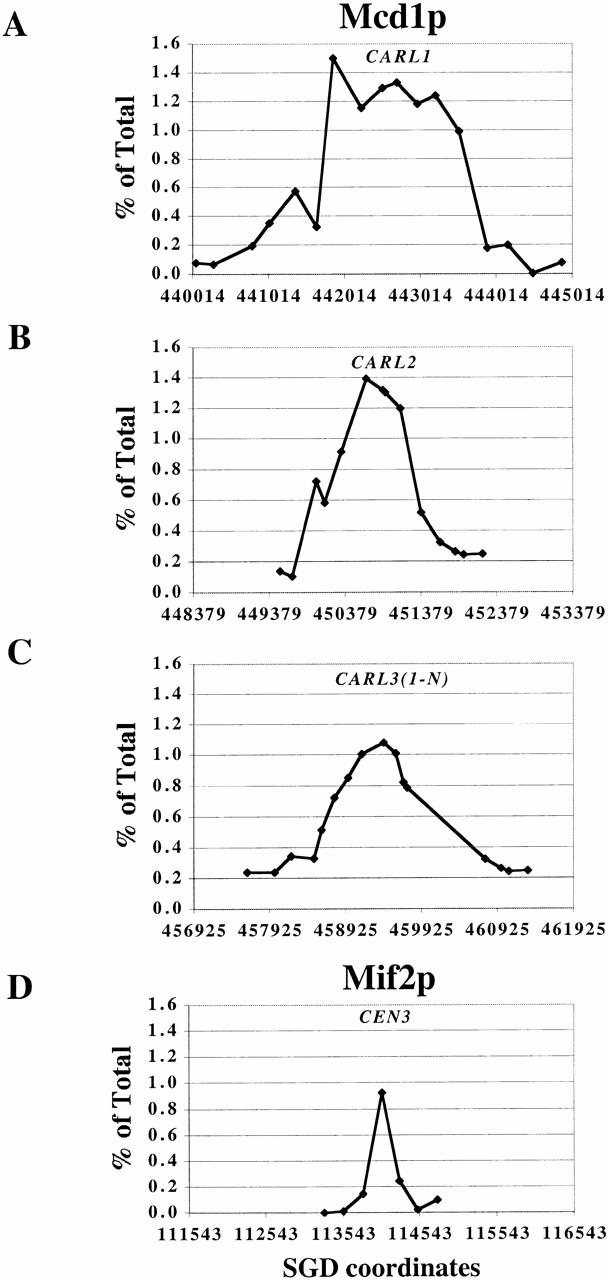
Figure 6.

Spreading of Mcd1p on various chromosomal arm sites as revealed by comparing its binding profile (top three graphs) on three CARLs on chromosome XII to the distribution of Mif2p binding to CEN3 and flanking sequences (bottom graph). The amount of immunoprecipitated DNA (as percent of total) is plotted on the y axis versus DNA sequence coordinates on the x axis. The scale of the x axis is constant in all graphs (total: 5 kb; minor division ∼1 kb).
