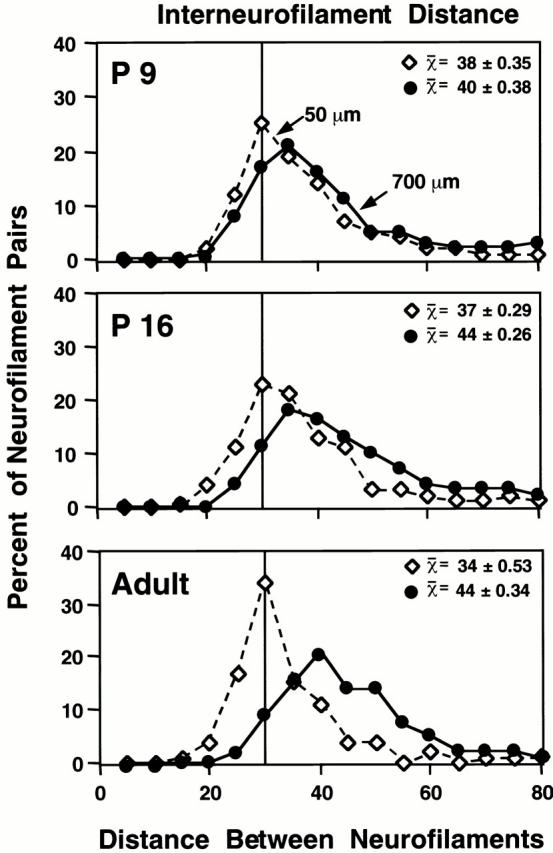
Figure 3.

Region-specific shifts in interneurofilament spacing during postnatal development. At each postnatal age, the nearest neighbor distance was calculated for every neurofilament in axons of calibers representative of those in the total axonal population at the 50-μm (⋄) and 700-μm (•) levels of the optic nerve (see Materials and Methods). Mean interfilament distances (SEM) are given for 1,175–2,500 neurofilaments at each axon level and postnatal age. Significant regional differences in interneurofilament spacing were detected as early as P9 (q = 2.06; Kruskal and Wallis analysis). A gradual shift to larger interneurofilament spacing was observed only at 700 μm between P9 and P16; thereafter, spacing remained unchanged (q = 2.62 and q < 0, respectively; Kruskal and Wallis analysis).
