
Figure 3.
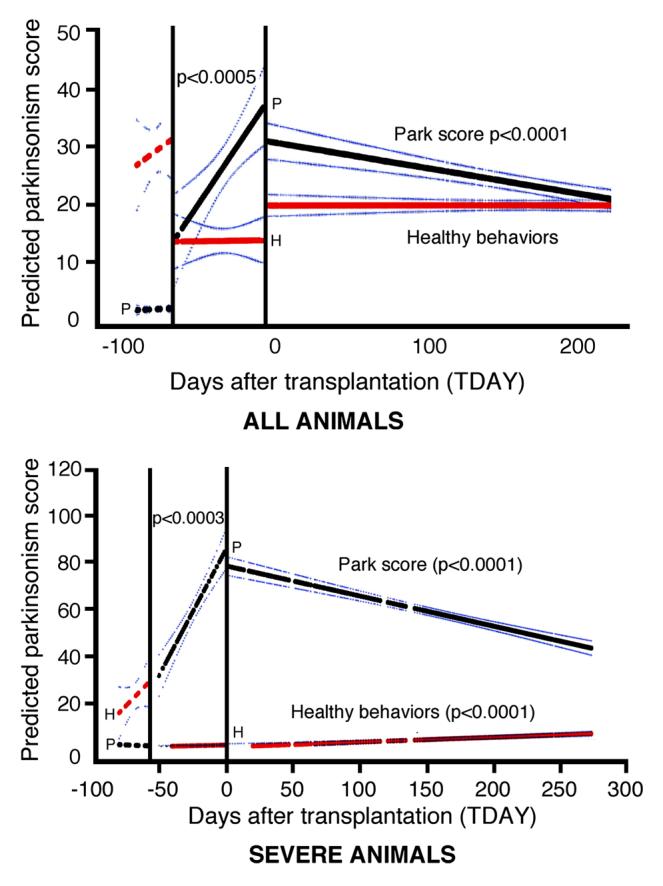
A regression analysis on the “park score” (black line) and the “healthy behavior” (red line) summary factors were calculated and the predicted slopes plotted for the baseline (Transplant Day ‘TDAY’) before −60, after MPTP (TDAY 0 to −60) and after grafting (0 to 270) were plotted for “all animals” and for the subset of the most “severe animals” with the 95% confidence interval of the predicted slope. Baselines did not show significant slopes All monkeys analyzed together, showed a positive slope in “park score” prior to grafting (slope +0.407, p<0.0005), and a significant improvement for the period after grafting (slope −0.046, p<0.0001). In the total group, the “healthy behaviors” showed no significant differences in the slope before grafting or after, whereas the severe animals (which had a lower pre-grafting level of “healthy behaviors”) showed a significant increase in these behaviors after grafting (slope +0.0235, p<0.0001). Slopes and significance levels were determined by linear regressions (GLM, Statistical Analysis System).