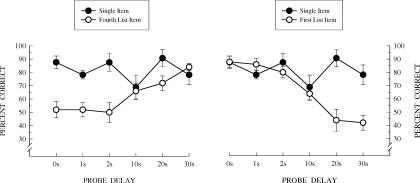
Fig 19.
Left panel: Single-item performance compared to last (fourth) list item performance. Right panel: Single-item performance compared to the first list item performance. Probe delays were the delays from Figure 18. Error bars are standard errors of the mean.

