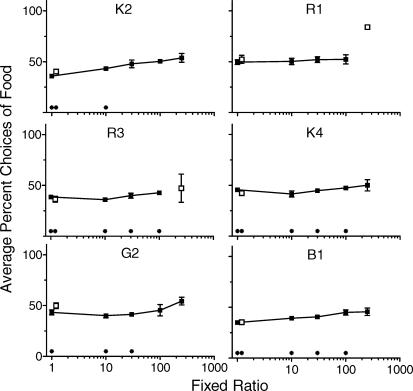
Fig 5.
Percent choices for the food reinforcer across the ratio values arranged. Choices are averaged over the final four sessions of the concurrent schedule phase and error bars correspond to one standard deviation in both directions. Open data points show the replication of FR 1 and the unstable choices at FR 250 (Rats R1 and R3).

