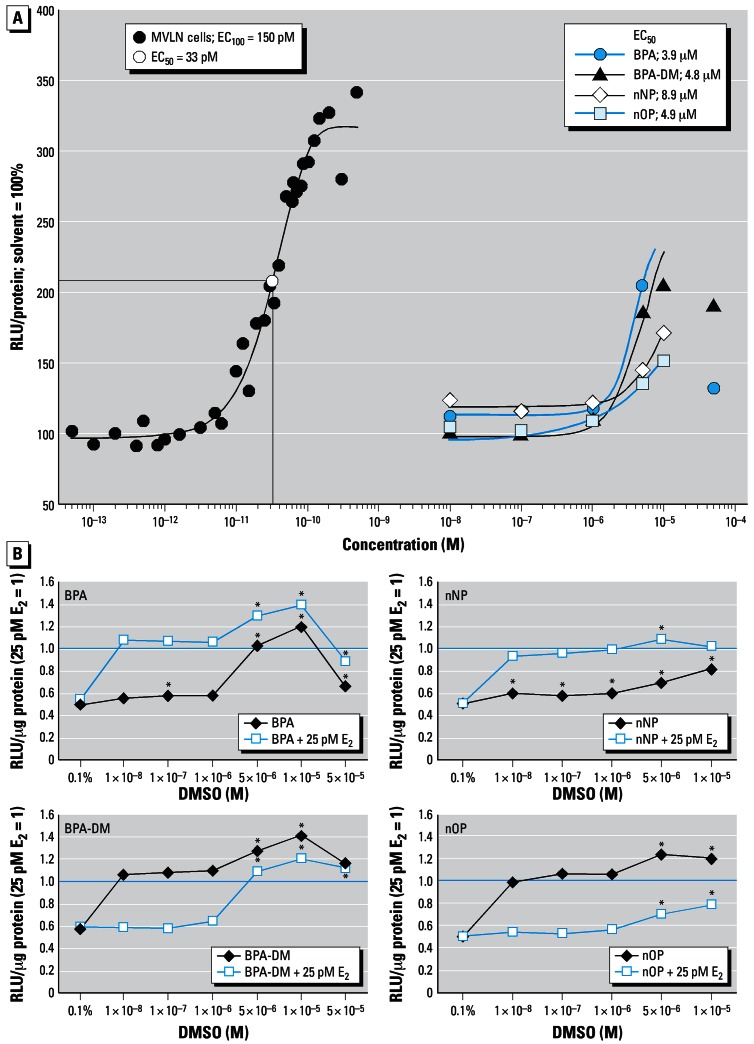
Figure 2.
Dose–response ER transactivation of E2 and the four test chemicals. (A) The MVLN cells were exposed to E2 in the concentration range of 0.05–500 pM and to the test chemicals at 10−8–10−4 M for 24 hr. Solvent control was set to 100%. E2 EC100 and EC50 as well as EC50 for each of the test chemicals were determined by Sigma Plot 8.0. (B) Agonistic and antagonistic ER activity of test chemicals BPA, BPA-DM, nNP, and nOP. The chemicals were tested alone or on co-exposure with 25 pM E2, which was set to 1. Mean values are shown (n ≥ 3).
*Significantly different from the respective solvent controls (cells + 0.1% DMSO; 25 pM E2 + 0.1% DMSO).

