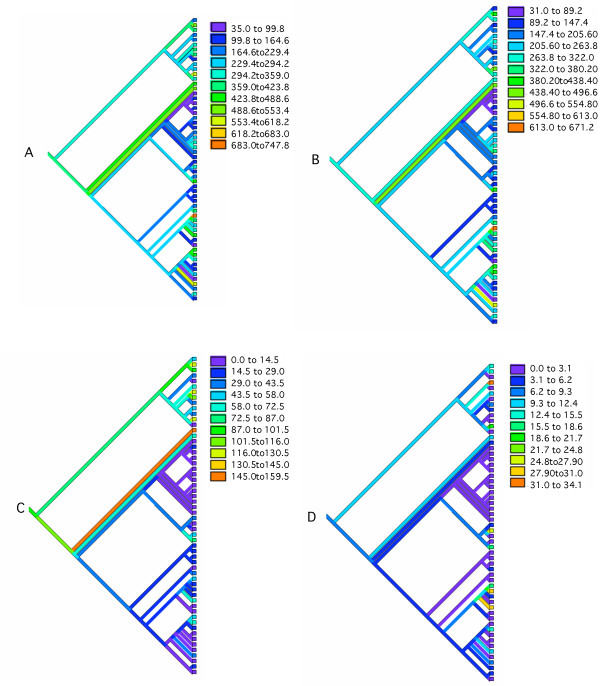
Figure 7.
The overlapping phase relations traced through the prokaryotic phylogeny using squared-change parsimony and color-coded in each of the 4 trees. Trees are color-coded by the frequency of overlaps as indicated in the color-scale. A: Total number of overlapping genes, B: Total number of codirectional overlaps, C: Total number of convergent overlaps, D: Total number of divergent overlaps

