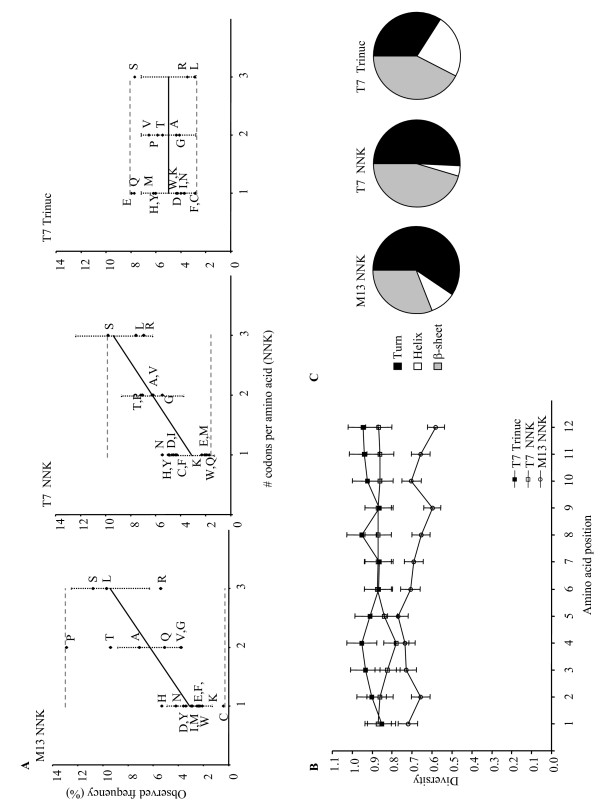
Figure 1.
Diversity analyses of the M13 NNK, T7 NNK, and T7 Trinuc random 12-mer peptide library populations. (A) AAFREQ analysis. Vertical dashed lines are error bars which represent the standard deviation of expected amino acid frequencies (Poisson statistics). Horizontal dashed lines represent the range of observed amino acid frequencies for each library peptide population. (B) DIVAA analysis. Error bars indicate the standard deviation in the estimation of diversity [7]. (C) Peptide secondary structure composition predictions. Portions of this figure were reproduced with kind permission from Wiley-VCH Verlag GmbH & Co. KGaA, see acknowledgements section for details.

