Figure 2.

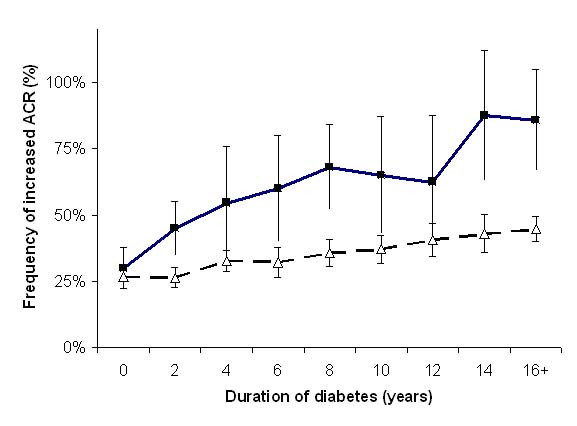
The frequency of an elevated urinary ACR (± 95% CI), stratified according to duration of diabetes. Dark squares denote Indigenous patients, white triangles denotes the total NEFRON cohort.

The frequency of an elevated urinary ACR (± 95% CI), stratified according to duration of diabetes. Dark squares denote Indigenous patients, white triangles denotes the total NEFRON cohort.