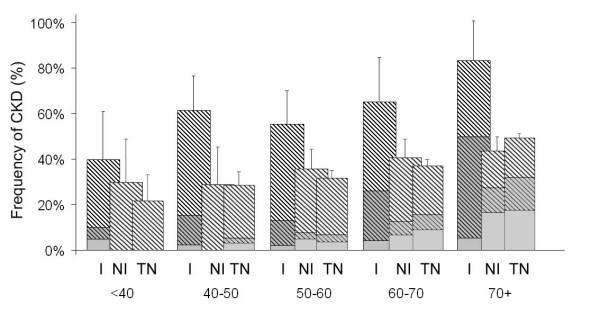
Figure 3.
The unadjusted frequency of (a) CKD, stratified according to age and ethnicity. Crosshatch denotes patients with an elevated ACR, shading denotes patients with an eGFR < 60 mol/min/1.73 m2, I = Indigenous, NI = Non-Indigenous, TN = total NEFRON cohort. Error bar denotes 95% confidence interval for CKD.

