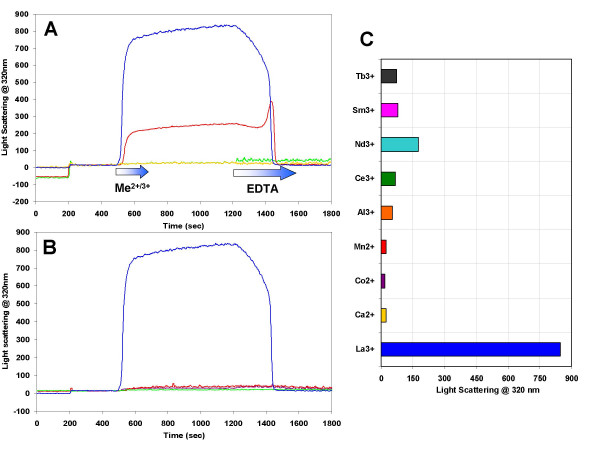
Figure 4.
Right angle light scattering timedrive plots for BRD1, 2 and control peptides/proteins in the presence of calcium or lanthanum and the maximum right angle light scattering responses using a variety of metal ions. The proteins were added at 200 s and the metals were introduced using a syringe pump starting at 500 s for a total of 120 s. A solution of EDTA was added to the cuvette using a syringe pump beginning at 1200 s until the right angle light scattering signal fell to its original level. A) Timedrive data for BRD1 with calcium (yellow line), BRD1 with lanthanum (red line), BRD2 with calcium (green line) and BRD2 with lanthanum (blue line). This plot illustrates that an increase in right angle light scattering (and therefore filament formation) is specific for peptides in solutions containing lanthanum and that it is a reversible process. This plot also highlights the larger increase in scattering for BRD2 over BRD1 at identical concentrations. B) Timedrives for a protein free control with lanthanum (purple line), a 15-mer peptide with α-helical propensity (red line), CAST (green line) and BRD2 with lanthanum (blue line) highlighting that the increase in right angle light scattering is specific to the BRD polypeptides only. C) A bar chart displaying maximum right angle light scattering responses at 320 nm for various metals at 10 mM final concentration in solutions containing 100 μM BRD2 peptide.

