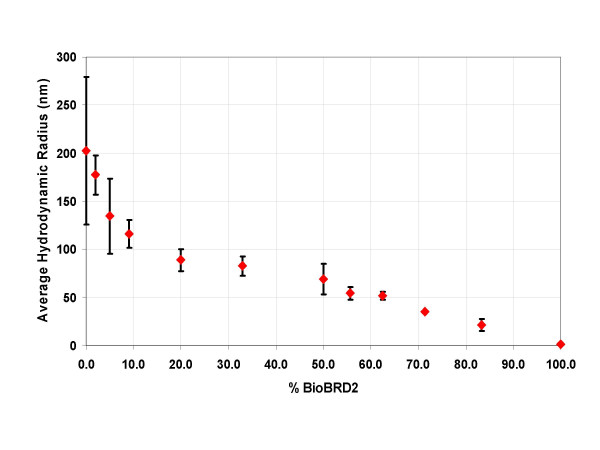
Figure 9.
Plot of the average hydrodynamic radius (nm) against the amount of BioBRD2 (%) compared to unmodified BRD2. A 100% BioBRD2 sample represents a solution free of BRD2 while a 50% BioBRD2 solution corresponds to a 1 to 1 mixture of the two peptides. Y-axis error bars represent the standard deviation between three samples for each data point. Note the inverse correlation between increase in hydrodynamic radius and decreasing amount of BioBRD2.

