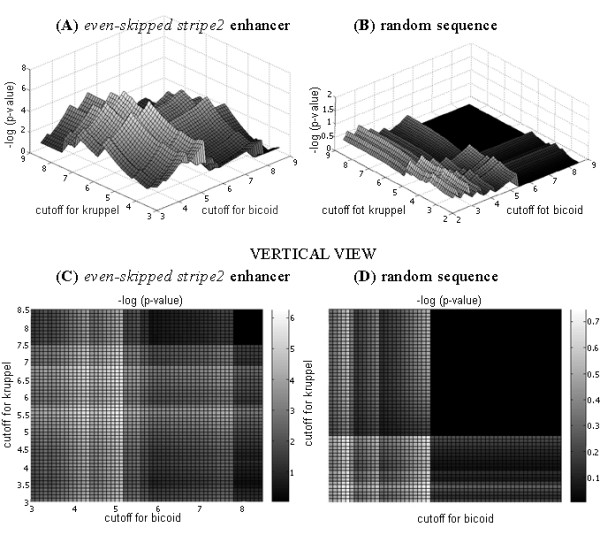
Figure 3.

P-value distribution for eve2 and random sequences. Distribution of log10 (Pvalue) calculated for the M1 model as a function of cutoff values for PWMs for BICOID and KRUPPEL in the even-skipped stripe 2 enhancer (A), in a random sequence (B). View from above: eve2 sequence (C), random sequence (D).
