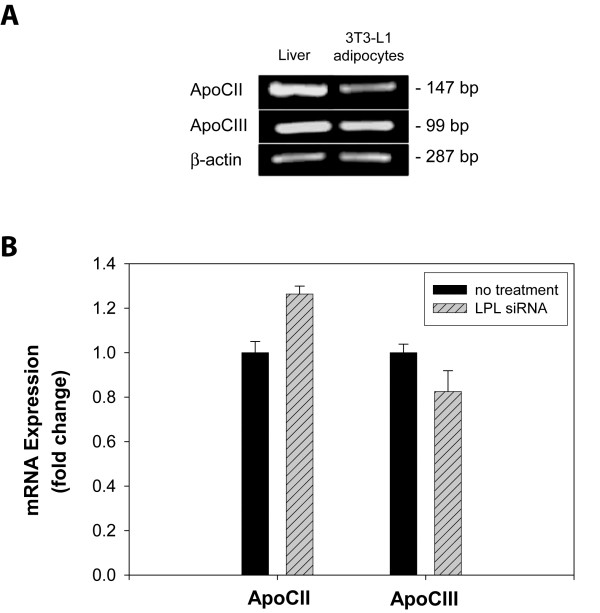
Figure 6.
Expression of apoCII and apoCIII in control versus LPL-siRNA-treated adipocytes. (A) 3T3-L1 pre-adipocytes were incubated with induction reagents for 5 days as in Fig. 1. Total RNA was isolated from 3T3-L1 adipocytes and mouse liver. mRNA was converted to cDNA with reverse transcriptase and the sequences for apoCII (147bp) and apoCIII (99 bp) were amplified by PCR. Amplification of β-actin sequence (287 bp) was performed as a loading control. (B) 3T3-L1 cells were transfected with LPL-siRNA, followed by incubation with adipocyte induction reagents. After five days post-induction, total RNA was isolated from adipocytes and apoCII and apoCIII expression were assessed by qRT-PCR. Results were analyzed by the Comparative CT method, with fully differentiated, non-treated adipocytes representing 100% expression. Amplification of β-actin mRNA was performed in parallel and used to normalize replicate points.

