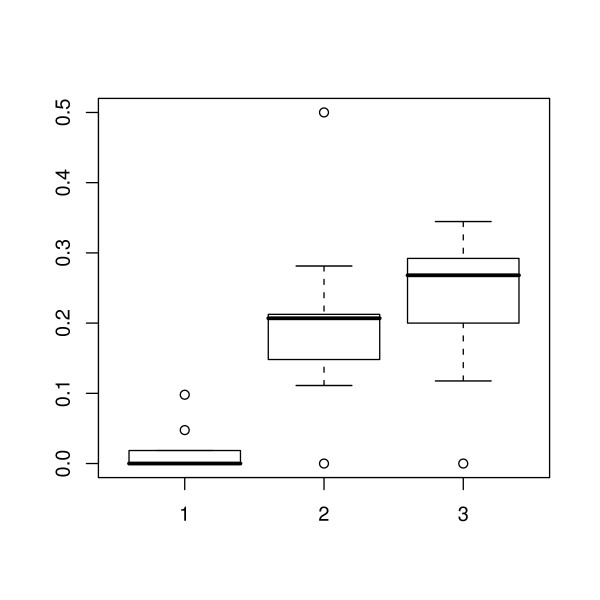
Figure 4.
Middle adipose layer thickness as a proportion of the total. Box-and-whisker plots for the middle adipose layer showing the 2.5, 25, 50, 75 and 97.5% cumulative relative frequencies of the data. The plot shows the ratio of the middle adipose layer to the total adipose thickness at the first, middle and last scanning session (1, 2 and 3 respectively). Values outside the range of the whiskers are plotted individually.

