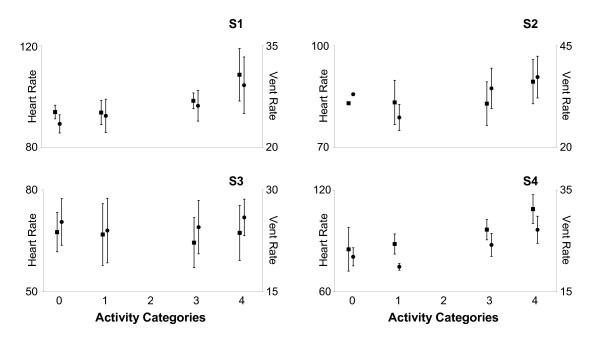
Figure 5.
Mean (± 1 standard deviation) HR (left axis) and VR (right axis) for each participant. Statistical analysis was conducted using the data of the group as a whole. Though individual differences were observed, overall, the Kruskal-Wallis non-parametric analysis of variance revealed that both HR (black square; p = 0.0207) and VR (black circle; p < 0.0001) generally increased as AC increased HR and VR increased. For participant S2, the standard deviations for both HR and VR in AC0 are small and therefore the SD bars do not extend beyond the size of the symbol used in the figure. For all participants, there were no differences for both HR (p = 0.1858) and VR (p = 0.5225) between the two lowest activity levels (AC0, AC1). For HR there was no difference between AC1 and AC3 (p = 0.8874). HR for AC4 was significantly greater than for AC0 (p = 0.0105) and AC3 (p = 0.0396); there was no statistical difference (p = 0.094) between AC1 and AC4. VR was significantly greater for AC3 than for AC0 (p = 0.0018) and AC1 (p = 0.0186), and VR for AC4 was significantly greater than for AC3 (p = 0.0107).

