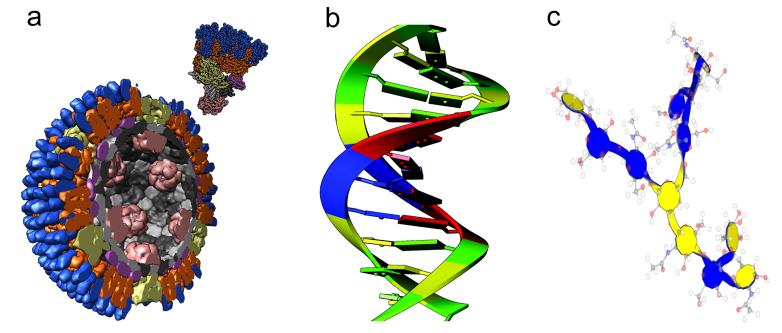
Figure 1. Levels of detail.
(a) Molecules depicted with low-resolution surfaces, orthoreovirus capsid (PDB 2cse). (b) Nucleic acid bases depicted as slabs [4]. (c) Carbohydrate depiction [5] with glucan ring top and bottom sides colored blue and yellow. Ball-and-stick model superimposed for reference.

