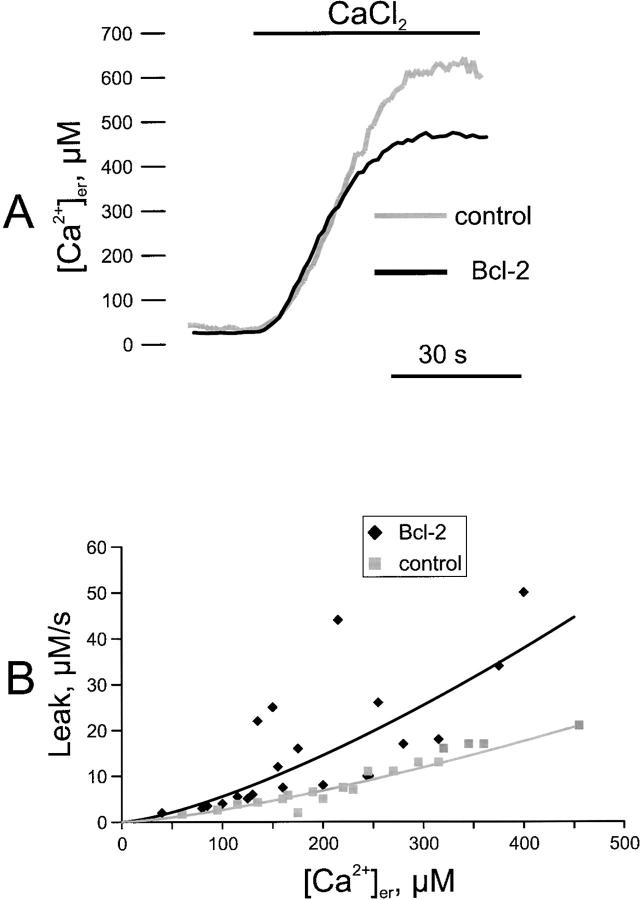
Figure 3.
Kinetics of ER Ca2+ uptake and release in control and Bcl-2–transfected cells. A, ER Ca2+ refilling in permeabilized cells. Parallel batches of HeLa cells were either cotransfected with erAEQmut and Bcl-2 (Bcl-2), or transfected with erAEQmut alone (control). 36 h after transfection, depletion of Ca2+ stores and AEQ were carried out as in Fig. 2. The coverslip with the cells was then transferred to the luminometer chamber. The perfusion medium was changed to IB/EGTA, and permeabilization was carried out by perfusing 100 μM digitonin (added to the same medium) for 1 min. After a 2-min wash with IB/EGTA, Ca2+ accumulation in the ER was initiated by switching the medium to IB containing a buffered Ca2+ concentration of 0.2 μM (see text for details). AEQ calibration was carried out as described in Materials and Methods. B, Dependence on [Ca2+]er of the Ca2+ leak rate from the ER. Transfection, depletion of Ca2+ stores, and AEQ reconstitution were carried out as in A, then the coverslip with the cells was transferred to the luminometer and perfused with KRB/Ca2+ until the steady-state [Ca2+]er was reached. Ca2+ release was initiated by treating the cells with 50 μM tBuBHQ. Based on the experimental trace, the maximal rates of Ca2+ release (measured from the first derivative) at different values of [Ca2+]er were calculated and plotted for Bcl-2–transfected and control cells. The plot contains data obtained from ten independent experiments. In each experiment, duplicate samples of control and Bcl-2–overexpressing cells were measured. Due to the mixing time in the luminometer chamber, the kinetics of [Ca2+]er decrease are sigmoidal and the maximal rate is obtained 2–3 s after addition of tBuBHQ. Accordingly, we considered the maximal rates the best approximation for the initial rate of [Ca2+]er decrease. The fitting of the curve shown in B was performed using Microsoft Excel software.

