
Figure 2.
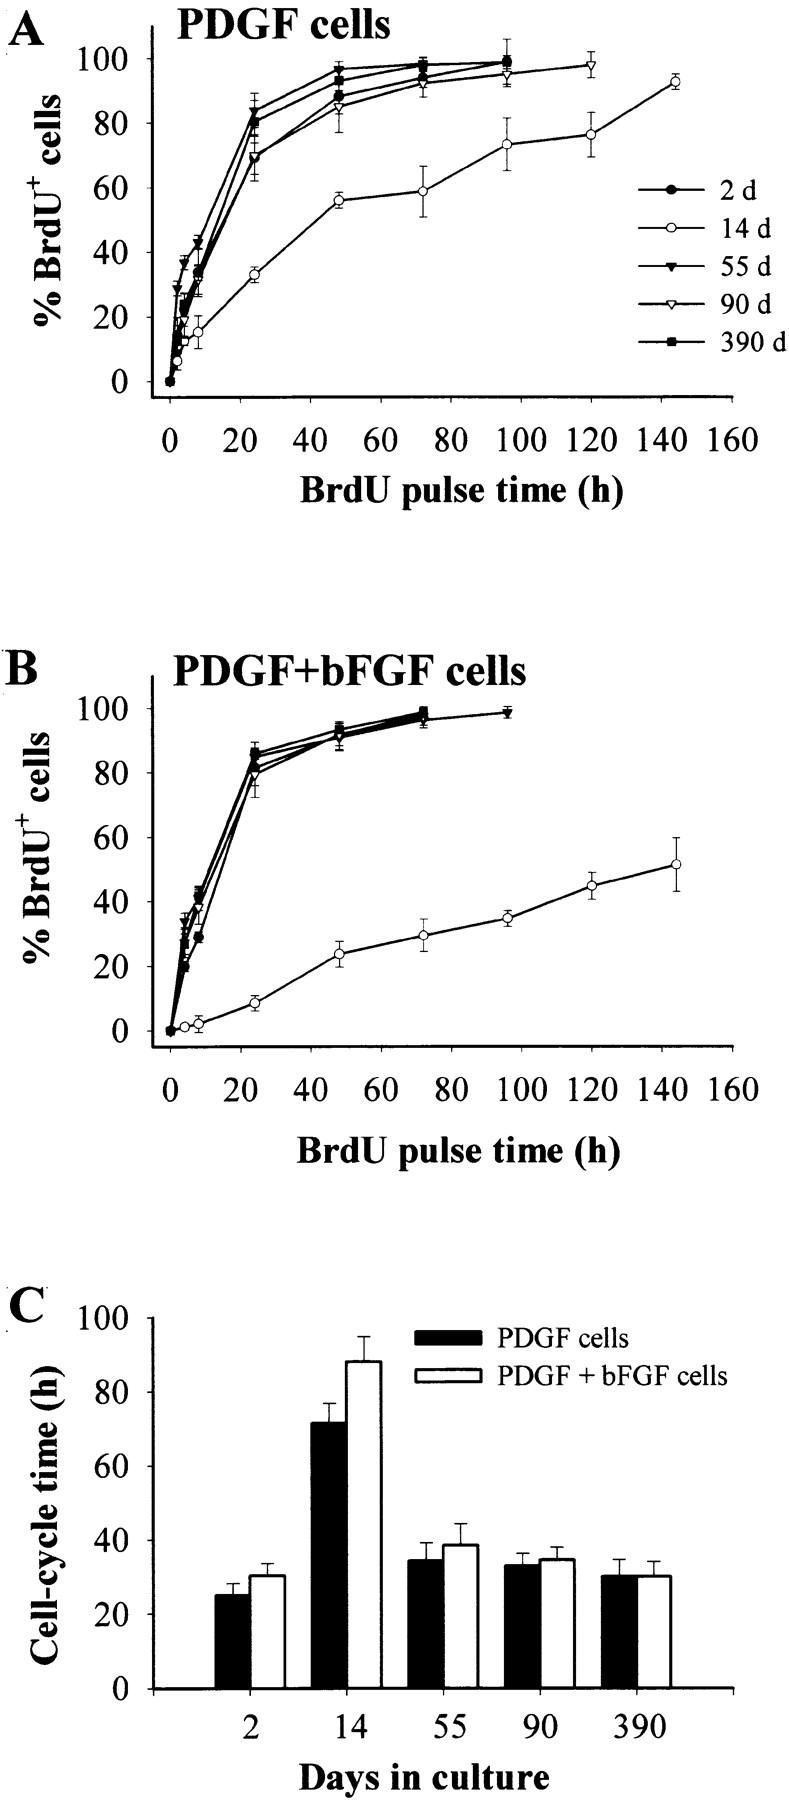
Cell cycle properties of OPCs in culture without TH for various periods of time in either PDGF (A) or PDGF plus bFGF (B). The cells were pulsed with BrdU for the times indicated, and the percentage of BrdU+ cells was determined by immunofluorescence. The results are expressed as mean ± SEM of two independent experiments, each with duplicate cultures for each time point. The calculated Tcs (see Materials and Methods) are shown in C.