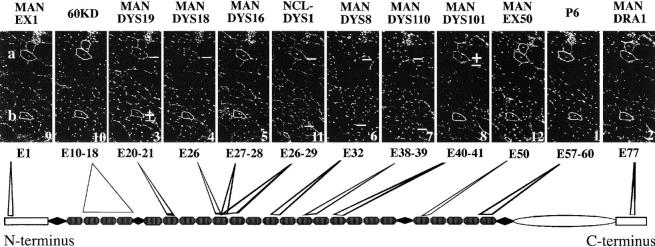
Figure 4.
Exon mapping of RF. Staining of serial sections with a panel of 12 Abs (name above and exon specificity below the pictures). Sections are arranged in such an order from left to right with Ab recognizing exons from NH2-terminal to COOH-terminal. The diagram below illustrates the position of the epitope(s) recognized by the Abs on the dystrophin molecule. Serial number of sections appears at the bottom right corners. Two isolated fiber clusters marked a and b with two and one fibers, respectively. Fibers a are recognized by Abs to NH2-terminal exons up to 18, but negative with Abs to exons 20–26. These fibers are positive with Ab to exons 27–28, but negative again with Abs to exons from 26–29 to 38–39 followed by relatively weak staining with Ab to exons 40–41. Fiber b is recognized by Abs to NH2-terminal exons up to 27–28, with relatively weak staining with Abs to exons 20–21. This fiber is not recognized with Ab against exons 26–29 to 38–39. Another revertant fiber of small caliber stained with Abs to exons 26–29 and 50 appears at the bottom of the sections, which are at the end of this serial sections. The primary Abs were detected with peroxidase method and the pictures are presented as negative image to enhance contrast. Nuclei appear positive due to the haematoxylin counterstaining.

