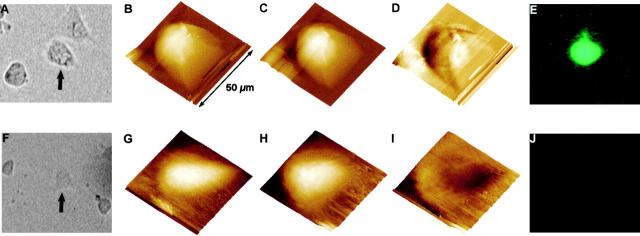
Figure 3.
Simultaneous imaging of Cx43-specific LY uptake and volume increase, in response to a reduction in the extracellular calcium concentration. A–E show a N2A cell stably transfected with Cx43, and F–J show a N2A cell transfected with expression vector only. A and F show optical phase-contrast images and E and J show LY uptake fluorescence images of the same cells (arrows in A and F); only Cx43-transfected cells took up LY. The volume changes were also measured for the same cells. B and G show volume profiles in normal OptiMEM, C and H show volume profiles after calcium removal. D and I show the net cell volume change (i.e., D = C − B and I = H − G. The volume of the Cx43-transfected cell changed significantly (D), whereas the cell transfected with expression vector only did not show any increase in cell volume (I). These data also show the unique feature of a combined AFM and optical microscopy system for multimodal imaging in living cells. All images are shown as surface plots, with the cell height color-coded, brighter being higher.

