
Figure 4.
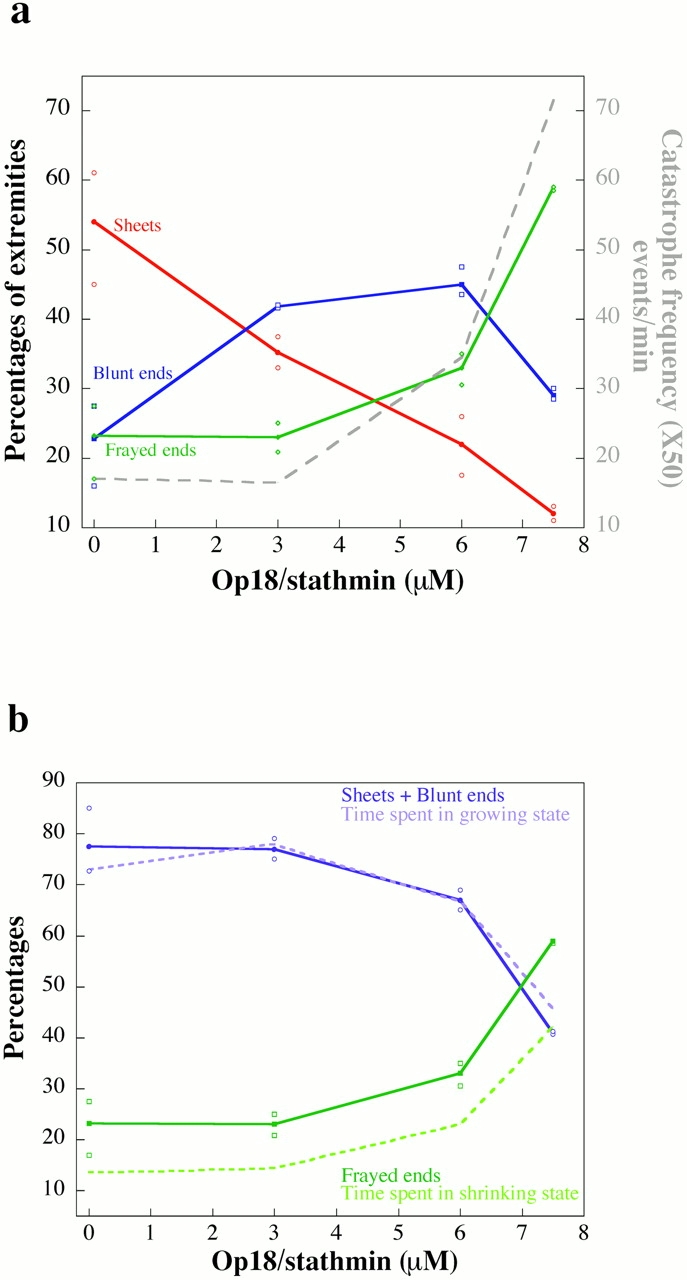
(a) Microtubule end structure in the presence of a different amount of recombinant Op18/stathmin added in interphasic extracts. Microtubule ends are represented as the percentage of the total number of extremities. Values are the mean of four (control) or two (3, 6, and 7.5 μM Op18/stathmin) experiments made in different extracts. For each condition, the mean value is represented by a closed symbol and the minimum and the maximum values by open symbols. (b) Microtubule end structure of growing and shrinking microtubules. The percentage of time spent in the growing state (light violet curve) as well as the combined proportion of sheets and blunt ends (dark violet curve) decrease with increased amount of recombinant Op18/stathmin added in interphasic extracts caused by the higher level of catastrophes. The percentage of time spent in the shrinking state (dark green curve) and the frayed end proportion (light green curve) follow the inverse change versus the Op18/stathmin concentration.