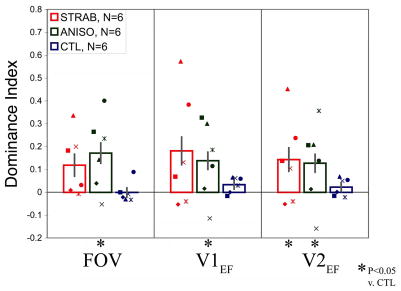
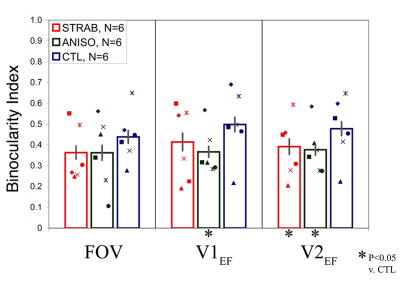
Fig. 3.
Ocular Dominance and Binocularity Index by Group and ROI. A. Group data is shown for each region of interest (from left-to-right, strabismic, anisometropic, and control). Mean DI is shifted toward the sound eye for strabismic and anisometropic groups. B. Mean BI is reduced in all ROIs for strabismic and anisometropic amblyopes. Asterisks indicate significant differences. Labeling conventions are the same as in Fig. 2.


