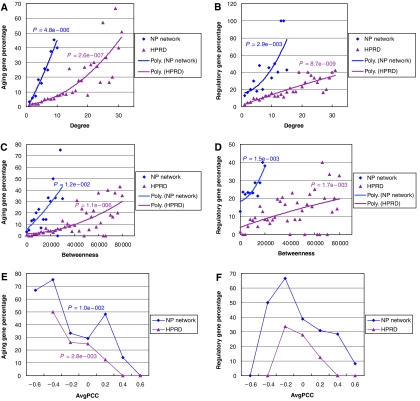
Figure 3.
Correlations of the percentage of aging genes and regulatory genes to PPI degree, betweeness of the proteins and the AvgPCC of the hubs. (A, B) The percentage of aging genes (A) or transcription regulators (B) among the NP or HPRD proteins of distinct PPI degrees are plotted against the PPI degrees of the proteins. The linear regression significance P-values are indicated above the polynomial fitted trend lines. (C, D) The percentage of aging genes (C) or transcription regulators (D) among the NP or HPRD proteins that are within each betweeness value interval of 2000 is plotted against minimal betweeness value of the interval. The linear regression significance P-values are indicated above the polynomial fitted trend lines. (E, F) The percentage of aging genes (E) or transcription regulators (F) among the NP or HPRD hubs that are within each AvgPCC value interval of 0.2 is plotted against minimal AvgPCC value of the interval. The linear regression significance P-values are indicated above the connected lines in (E).

