
Fig. 2. Identifying GCR neurons and CG neurons.
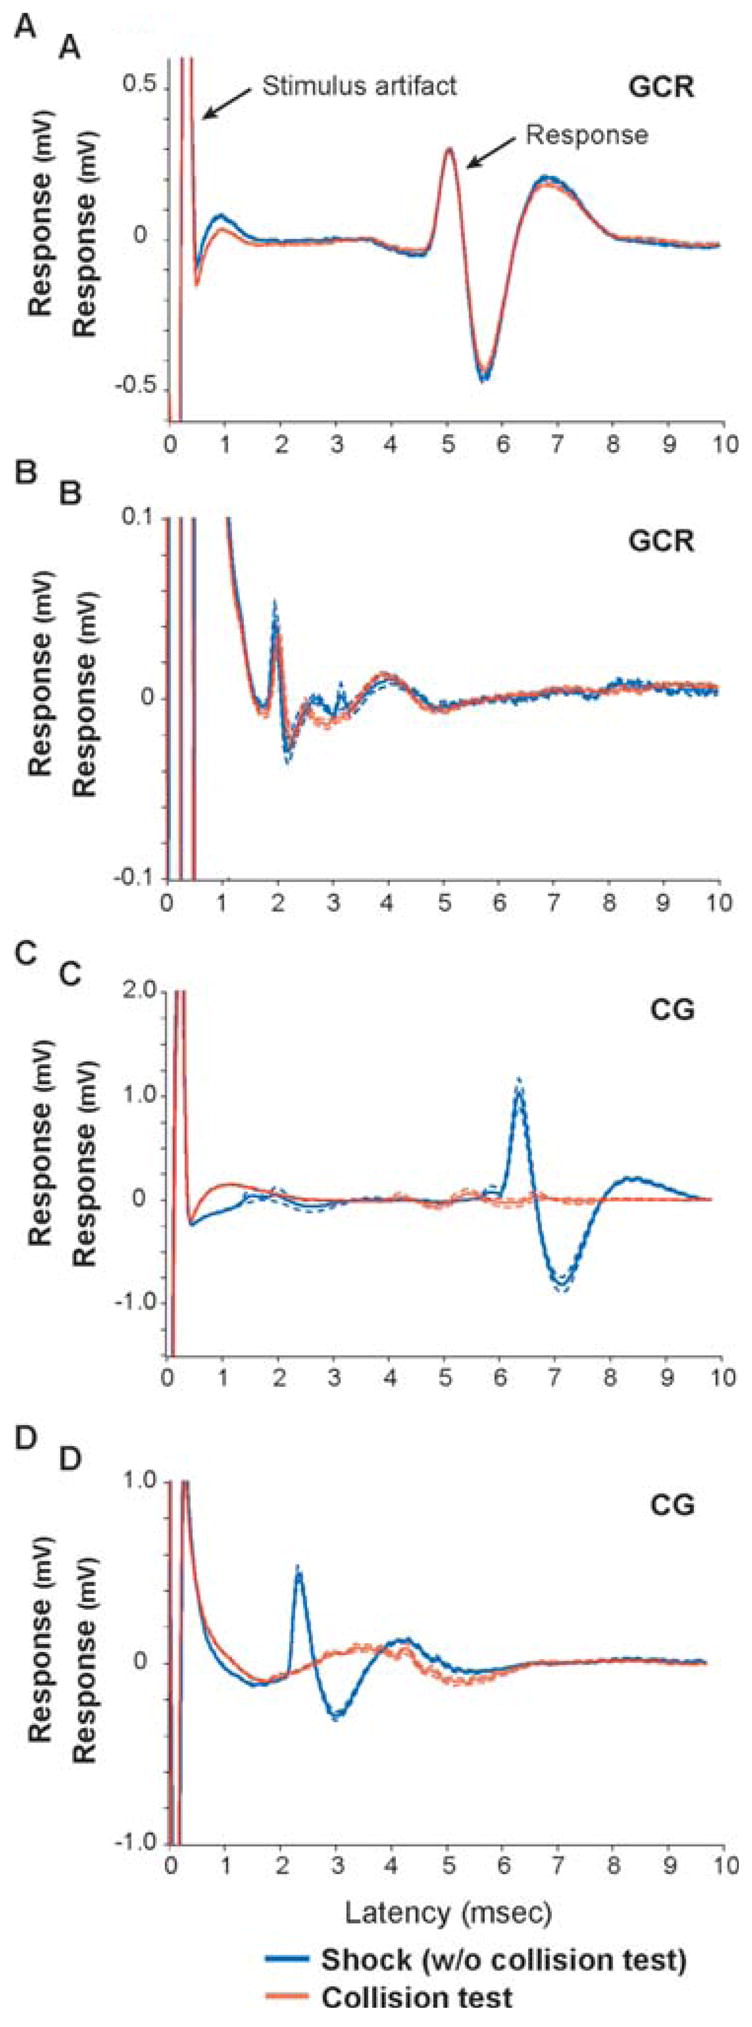
A–D. Averages of waveform traces for four representative neurons, two GCR neurons (A, B) and two CG neurons (C, D). Traces are aligned to the stimulus artifact representing time 0 (left arrow in top trace). Responses to shock trials (without collision test) are shown in blue and responses to collision trials are shown in red. Dashed lines indicate the standard error for each trial type average. The two GCR neurons have latencies of 4.7 msec and 1.7 msec. The two CG neurons have latencies of 6.1 msec and 2.2 msec.