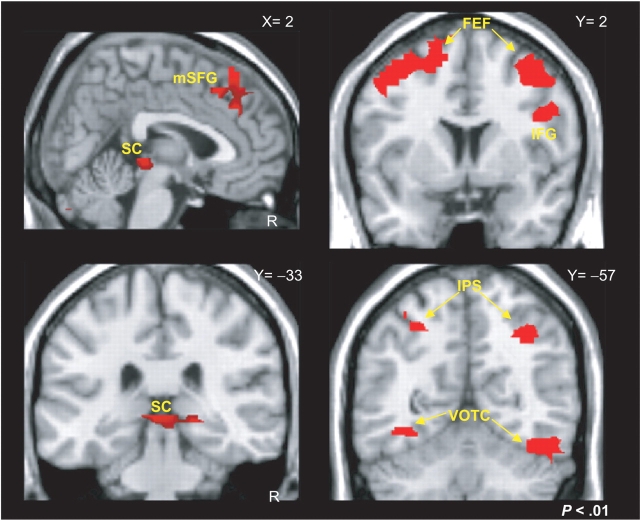
Fig. 4.
Voxel-based analysis. The red colormaps reveal the effects of a random-effects contrast where typical scanpaths evoked a significantly stronger BOLD response relative to atypical scanpaths. Regions showing significant differences included bilateral frontal eye fields (FEF), medial portions of the superior frontal gyrus (mSFG), right inferior frontal gyrus (IFG), the superior colliculi (SC), bilateral intraparietal sulci (IPS) and bilateral ventral occipitotemporal cortex (VOTC).

