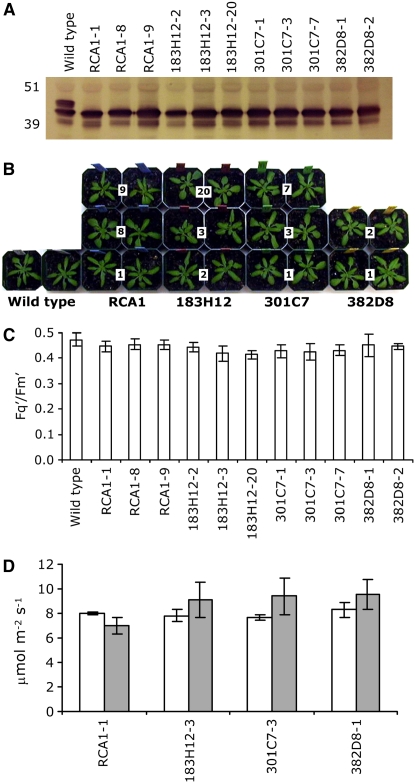
Figure 3.
Functional Complementation of Δrca Mutants Expressing RCA1 and Thermostable Variants 183H12, 301C7, and 382D8 under Normal Growth Conditions (22°C).
(A) Immunoblot analysis of total protein from 3-week old leaves. Numbers indicate the line designations of independent transformation events.
(B) Photographs depicting the similar size of all the plants described above when grown under normal conditions.
(C) Photosynthetic performance (Fq′/Fm′) of the plants (8 to 10 plants/independent line) described above monitored by fluorescence image analysis.
(D) Effect of temporary (1 h) moderate heat stress treatment on photosynthesis rates (μmol m−2 s−1) of Δrca transgenic lines expressing RCA1 and thermostable variants. The net photosynthesis of four independent plants per line was monitored using an infrared gas analyzer at 22°C (white) and 30°C (gray).

