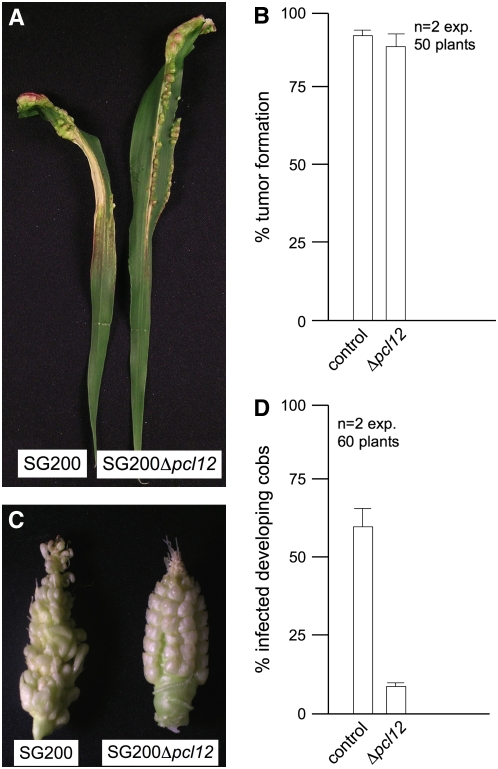
Figure 9.
Virulence of Δpcl12 cells
(A) Leaves of plants inoculated either with SG200 or SG200Dpcl12. Note the presence of anthocyanin stains and tumors
(B) Quantification of tumor formation on infected maize plants.
(C) Cobs of plants inoculated either with SG200 or SG200Dpcl12. Note the anomalous development of infected kernels.
(D) Quantification of tumor formation on infected cobs.

