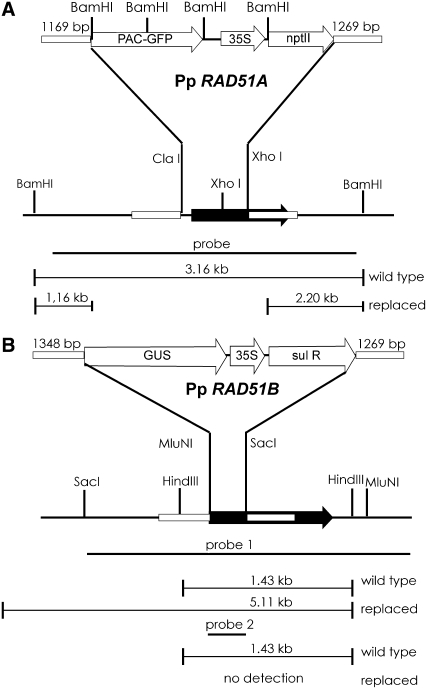
Figure 1.
Schematic Representation of P. patens RAD51 Genes and the Gene Targeting Strategy.
Schematic representations of Pp RAD51A (A) and Pp RAD51B (B). The gene targeting vectors used to inactivate the genes are shown above (not to scale). Restriction sites used for cloning or DNA gel blot analysis are shown. The probes used for DNA gel blotting and fragment sizes of authentic and replaced genes are shown below the sketch. Black arrows indicate the RAD51 target gene coding regions. Regions of homology (given in base pairs) between target loci and replacement vectors are shown as small boxes. The probes used for DNA gel blotting are shown as black bars. Open arrows denote genes and promoters. PAC-GFP, fusion protein of chloroplast-targeted pale cress and GFP; 35S, cauliflower mosaic virus 35S promoter; nptII, kanamycin resistance gene; sul R, sulfonamide resistance gene.

