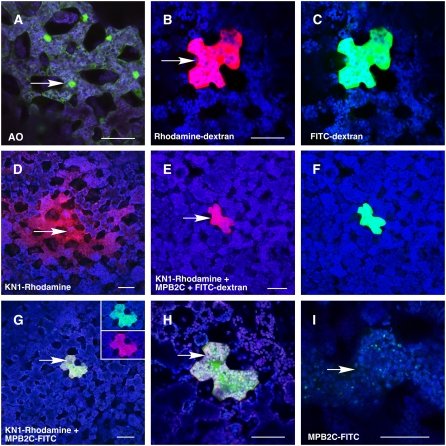
Figure 3.
Microinjection Assays Establish the Inhibition of KN1 Cell-to-Cell Trafficking in the Presence of MPB2C.
Confocal microscopy images of mesophyll cells of 3- to 5-week-old N. benthamiana source leaves at 3 min after injection of fluorescent probes.
(A) Microinjection of the small dye acridine orange (molecular weight = 302) fluorescently staining cell walls, RNA, and DNA. A green fluorescence signal appeared in nuclei and cytoplasm of the injected (arrow) and neighboring cells, consistent with the dye having moved symplasmically between cells via PD. The confocal image was recorded avoiding the red channel.
(B) and (C) An equimolar mixture of 11-kD rhodamine-dextran (red) (B) and 12-kD F-dextran (green) (C) remains in the injected cell, confirming that PD are not dilated by the trafficking of endogenous NCAPs.
(D) Cell-to-cell movement of recombinant rhodamine–labeled KN1 (red).
(E) and (F) An equimolar mixture (2 μg/μL) of At MPB2C (no fluorescent tag) and rhodamine-KN1 (red) (E) with the fluorescent tracer 12-kD F-dextran (green) (F) remains in the injected cell.
(G) An equimolar mixture (2 μg/μL) of FITC-labeled At MPB2C (green) and rhodamine-KN1 (red) was used as a probe. No fluorescent signal of proteins could be detected in adjacent cells. The insets show the injected cell avoiding the red and the green channel, confirming the presence of both fluorescently tagged proteins.
(H) Higher magnification of the injected cell in (G).
(I) A single cell is shown after injection with FITC-labeled At MPB2C (green). The image was taken at low laser energy settings to visualize the appearance of fluorescently tagged At MPB2C at small green punctae in the cytosol.
Note that in merged images, coinciding signals of green and red channels appear yellow/orange. Fluorescent detection filter settings where as follows: blue, chloroplast 684 to 777 nm; green, FITC-tagged 505 to 537 nm; red, rhodamine-tagged 620 to 650 nm. Arrows indicate sites of injection. Bars = 80 μm.

