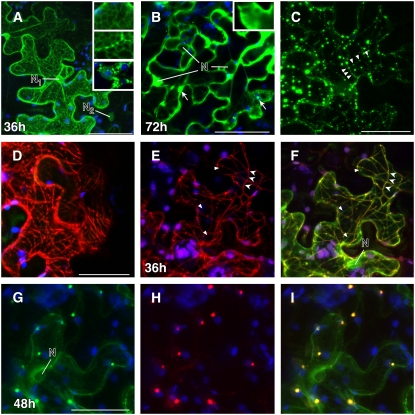
Figure 6.
Colocalization and Intracellular Distribution of KN1 and MPB2C Fluorescent Fusion Proteins.
Confocal images of N. benthamiana source leaves expressing fluorescent fusion proteins at 1 to 3 d after agroinfiltration.
(A) After 36 h, KN1-GFP is detected in the nuclei and at the nuclear envelope (N1). Also, a cellular distribution similar to that in ER-associated proteins (ER-GFP) is observed in high-expressing cells. In low-expressing cells, no association with the nuclear envelope is detected (N2). After heat treatment (2 min of high fluorescent light), the KN1-GFP–tagged ER-like structures collapse and appear as large bodies outside the nucleus (insets).
(B) High levels of KN1-GFP appear as soluble protein in the cytosol and as aggregates (arrows) at 72 h after infiltration.
(C) and (D) Images exemplifying the cellular distribution of At MPB2C-GFP (C) and At MPB2C-RFP (D). Green and red fluorescent punctae and filaments are detected aligned with arrays previously shown to resemble microtubules (Kragler et al., 2003).
(E) to (I) Tissue coexpressing KN1-GFP and Nt MPB2C-DsRED after 36 h.
(E) Nt MPB2C-DsRED appears at thin filaments (arrowheads) and in small punctae.
(F) The same cell shows the expression of Nt MPB2C-DsRED colocalizing with KN1-GFP in the merged image. Triangles indicate KN1-GFP not colocalizing with Nt MPB2C-DsRED. Note that the majority of detected KN1-GFP and Nt MPB2C is present at filamentous structures resembling microtubules (arrowheads).
(G) Cells coexpressing KN1-GFP after 48 h.
(H) Cells coexpressing At MPB2C-mRFP after 48 h.
(I) Merged image of (G) and (H). Green signal emitted by GFP fused to KN1 is detected with At MPB2C-mRFP in punctae.
Blue indicates chloroplast autofluorescence. N, nucleus. Bars = 40 μm.

