Figure 7.
At MPB2C Interaction with STM Depends on the Presence of the HD in Split YFP Interaction Assays.
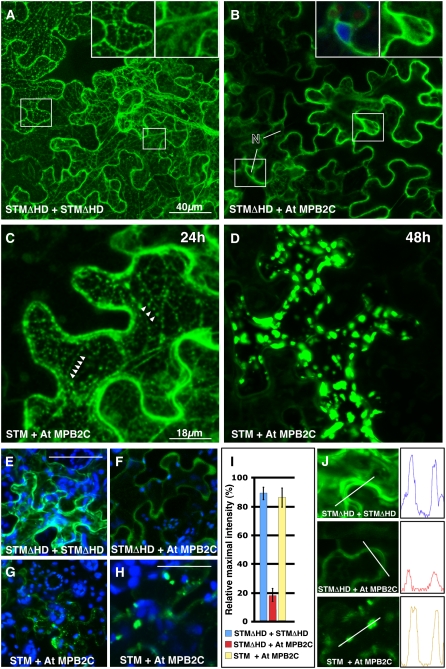
Confocal images of N. benthamiana source leaves expressing split YFP constructs after agroinfiltration.
(A) Cells expressing NYFP-STMΔHD and CYFP-STMΔHD. Two days after agroinfiltration, high YFP fluorescence signals were present in the cytosol and in association with ER-like structures. Insets show magnified regions with fluorescent signals in ER-like structures and the cytosol.
(B) Cells expressing NYFP-STMΔHD and CYFP-At MPB2C at 2 d after agroinfiltration. Relatively low YFP signals were detected exclusively in the cytosol of epidermal cells. Insets show magnified regions indicated by rectangles with nucleus (4′,6-diamidino-2-phenylindole [DAPI]–stained) and cytosol. Note that no yellow fluorescent signal was detected in nuclei (N). Blue indicates DAPI staining, and green indicates YFP fluorescence.
(C) and (D) Cells expressing NYFP-STM and CYFP-At MPB2C.
(C) One day (24 h) after agroinfiltration, high YFP fluorescence signals were present in mobile punctate structures (arrowheads) and the cytosol.
(D) After 2 d (48 h), large fluorescent punctae appeared and no fluorescent signals were detected. Note that the YFP signal in the cytosol disappeared and no YFP signals were detected in nuclei.
(E) to (J) Quantification of YFP fluorescence in epidermal cells expressing split YFP constructs. Note that to facilitate measurements, the confocal detection system was set to low sensitivity to avoid signal saturation and the tissues were scanned with the same confocal laser intensity, pinhole, gain, number of stack settings, and z-axis distance from the cell surface.
(E) and (F) Cells expressing NYFP-STMΔHD and CYFP-STMΔHD emit a high fluorescence signal (E) compared with the very low signals in the cytosol detected in cells expressing NYFP-STMΔHD and CYFP-At MPB2C (F). Bar = 50 μm.
(G) Cells expressing NYFP-STM and CYFP-At MPB2C emitted high YFP fluorescence signals in punctate structures.
(H) Higher magnification of a different cell and tissue with similar punctate fluorescence signals. Bar = 20 μm. Blue indicates chloroplast autofluorescence, and green indicates YFP fluorescence.
(I) Column chart of relative fluorescence intensity measurements in cells expressing the split YFP constructs. Confocal images of epidermal cells were analyzed for their maximal YFP fluorescence signal levels. The maximal signals of nine cells in four different infiltrated leaves were measured and the average was calculated (error bars = average deviation).
(J) Examples of the analyzed cell regions and the measured maximal emission in these cells.

