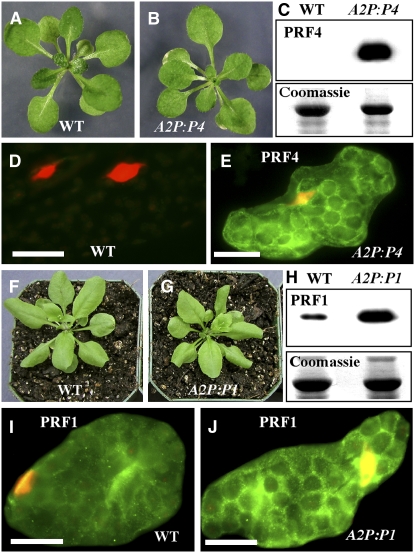
Figure 4.
Effect of Profilin Ectopic Expression and Overexpression on Plant Growth.
(A) Three-week-old wild-type seedling.
(B) Three-week-old transgenic seedling misexpressing PRF4.
(C) Protein gel blot (top panel) showing expression of PRF4 in transgenic (A2P:P4) but not wild-type leaf sample. Top blot reacted with MAbPRF45. The bottom panel shows a Coomassie blue–stained duplicate gel.
(D) Wild-type leaf cell labeled with MAbPRF45 showing no staining. Nuclei stained with 4′,6-diamidino-2-phenylindole (DAPI) are shown in red.
(E) Transgenic (A2P:P4) leaf cell showing strong staining for PRF4. Orange color indicates nucleus.
(F) Twenty-five-day-old wild-type plant.
(G) Twenty-five-day-old transgenic plant overexpressing PRF1 (A2P:P1).
(H) Protein gel blot (top panel) showing strong expression of PRF1 in transgenic (A2P:P1) plant. Wild-type leaf sample shows a 14-kD faint band. Top blot reacted with PRF1-specific MAbPRF1. The bottom panel shows a Coomassie blue–stained duplicate gel.
(I) Wild-type leaf cell labeled with MAbPRF1 showing a weak staining. Nucleus stained with DAPI is shown in red.
(J) Transgenic (A2P:P1) leaf cell showing a strong staining for PRF1. Orange color indicates nucleus.
Bars = 20 μm.

