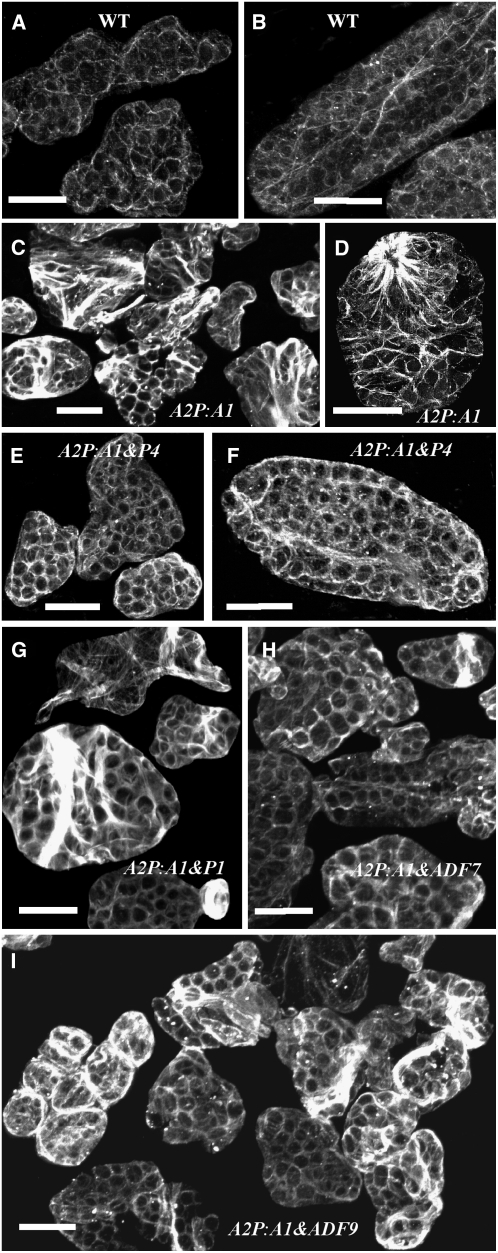
Figure 6.
Immunofluorescence Labeling of Actin in Leaf Cells.
(A) and (B) The wild type.
(C) and (D) Dwarf plant cells misexpressing ACT1.
(E) and (F) Cells from a suppressed, normal double transgenic plant coexpressing ACT1 and PRF4.
(G) Cells from a dwarf double transgenic plant coexpressing ACT1 and PRF1.
(H) Cells from a normal double transgenic plant coexpressing ACT1 and ADF7.
(I) Cells from a dwarf double transgenic plant coexpressing ACT1 and ADF9.
All samples were labeled with MAbGPa. Bars = 20 μm.

