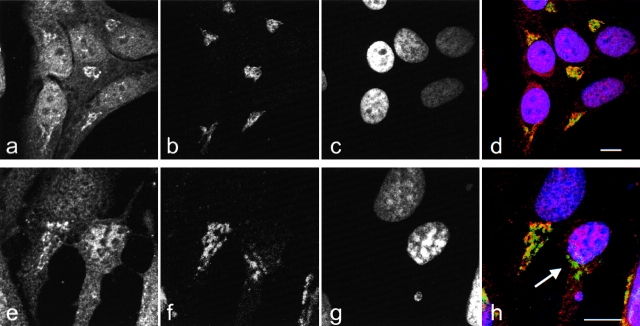
Figure 7.
The NH2-terminal fragment of golgin-160 is released from Golgi membranes after cleavage by caspase-2. Untreated HeLa cells (a–d) and HeLa cells treated with 1 μm staurosporine for 1 h (e–h) were fixed, permeabilized, and triple labeled with anti–golgin-160(N) (a and e), which was visualized as red; antigiantin (b and f), which was visualized as green; and DAPI (c and g), which was visualized as blue. Overlapping red and green pixels appear yellow (d and h). Arrow in h denotes an apoptotic cell, which no longer stains for the NH2-terminal portion of golgin-160. These results are representative of three separate experiments. Bars, 10 μm.

