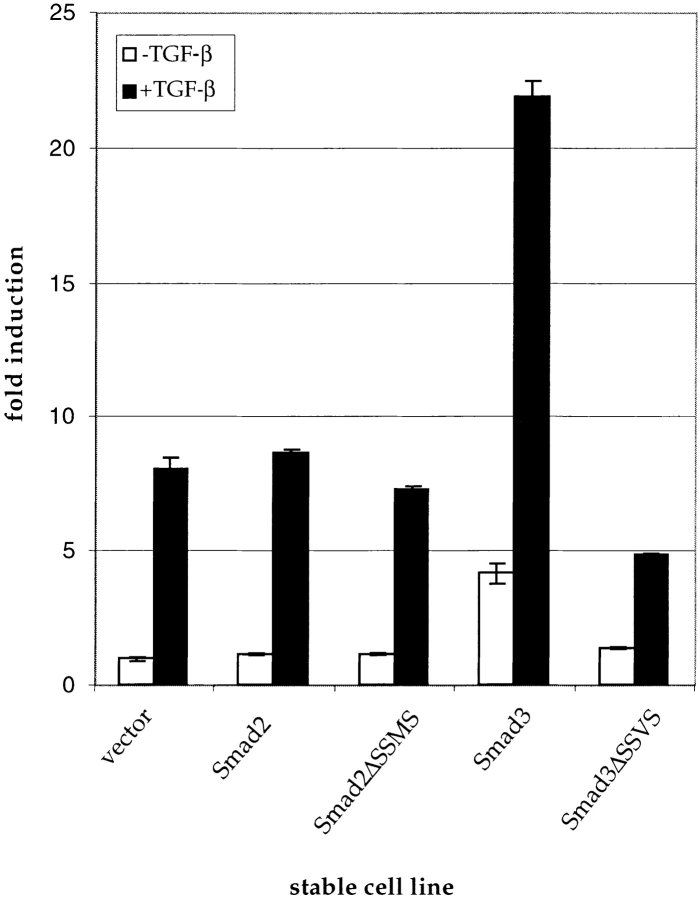
Figure 6.
Effect of Smad2, Smad3, or their dominant negative mutants on differentiation-dependent gene expression and proliferation in the absence and presence of TGF-β. (top) Northern analysis of adipocyte marker gene expression. Total RNA from stable cell lines was isolated on the indicated days and processed as in Fig. 4 B. −TGF-β lanes: Smad2Δ, Smad2ΔSSVS, Smad3Δ, and Smad3ΔSSVS. All RNA samples of cells without TGF-β treatment were on the same membrane, but the autoradiogram in the figure has been cut into panels for easier viewing. +TGF-β lanes: v, vector; 2, Smad2; 2Δ, Smad2ΔSSMS; 3, Smad3; and 3Δ, Smad3ΔSSVS. (bottom) Proliferation rate of vector control cells and cells overexpressing Smad2, Smad3, Smad2ΔSSMS, or Smad3ΔSSVS are as shown. Cells were either untreated or treated with 5 ng/ml TGF-β, and the level of [3H]thymidine incorporation was measured. Values are expressed as fold induction relative to the untreated vector control.


