Figure 7.

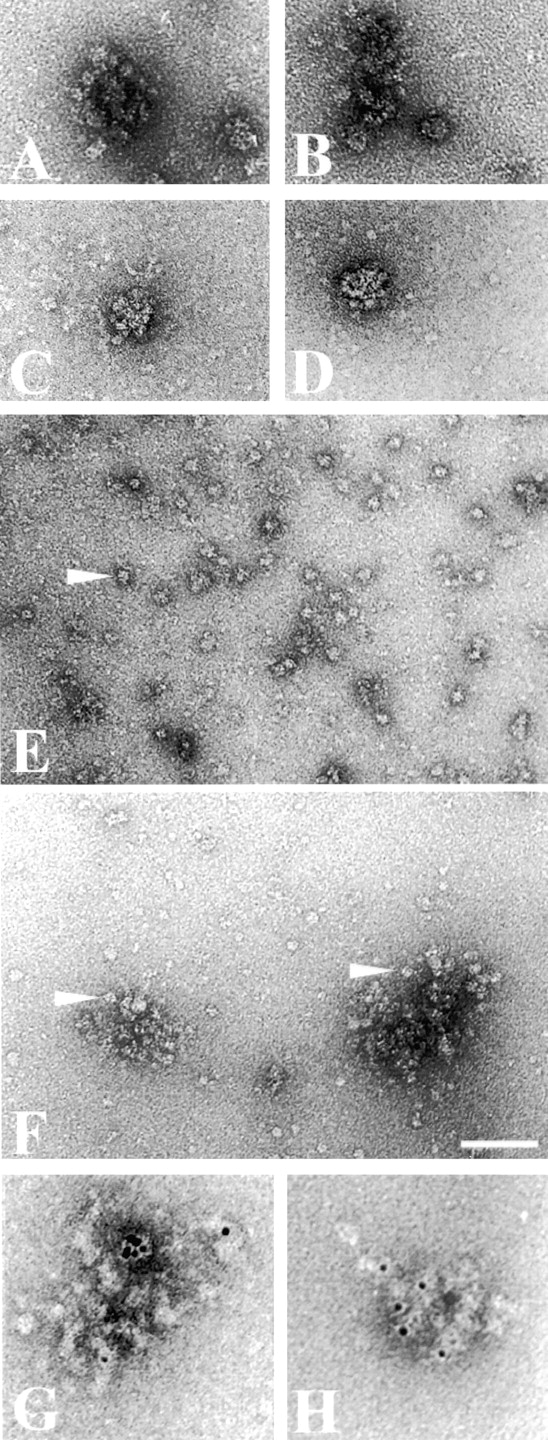
Electron microscopic analysis of the nucleolar assembly. (A and B) Clusters observed in fraction PA600 diluted 100 times in buffer B (see Material and Methods). (C and D) Clusters observed in fraction PA600 Δ135 diluted in the same conditions as above. (E) Field of fraction B2000 diluted in high ionic strength buffer. Pol I molecules are homogeneously dispersed on the carbon film (see also Schultz et al. 1990; Milkereit et al. 1997). The arrowhead points towards a pol I particle. (F) Field of fraction B2000 diluted in low–ionic strength buffer. The low ionic strength induces the formation of the clusters. The arrowheads point towards particles of the size of pol I. (G) Cluster labeled with the immunogold probe directed against Fpr3p. (H) Cluster labeled with the immunogold probe directed against Nop1p. Bar: 100 nm (A–F); and 50 nm (G and H).
