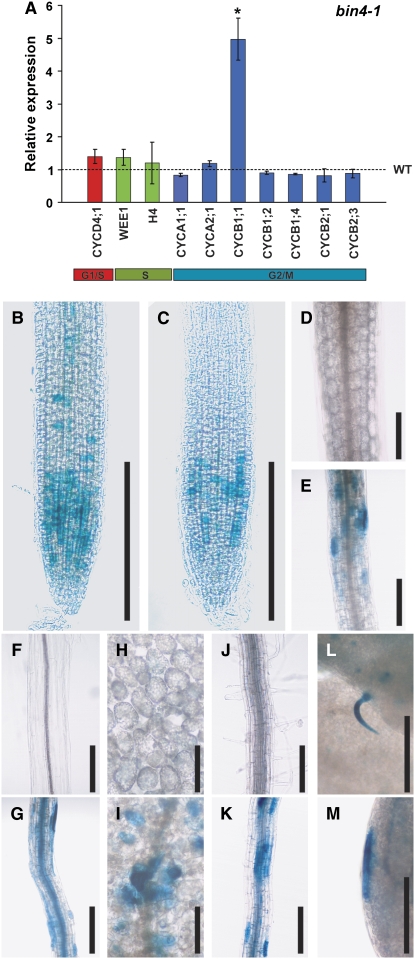
Figure 7.
Transcriptional Expression Analyses Reveal the Ectopic Expression of the G2/M Phase Marker CYCB1;1 in Postmitotic Cells of bin4 Mutants.
(A) Quantitative real-time expression analysis of several core mitotic cell cycle genes. Actin2 expression level was used as a reference. Colored columns represent the relative expression of individual genes in bin4-1 compared with the wild-type expression levels, indicated as a dashed line. The values represent averages of four independent replicates ± sd, and the one that is statistically different from wild type (Student's t test; P < 0.05) is marked by an asterisk.
(B) to (M) Expression patterns of pCYCB1;1:GUS in 7-d-old primary root tips ([B] and [C]), 7-d-old, light-grown hypocotyls ([D] and [E]), 4-d-old, dark-grown hypocotyls ([F] and [G]), mature cotyledons ([H] and [I]), mature roots ([J] and [K]), and mature leaves ([L] and [M]). (B), (D), (F), (H), and (J) show wild-type organs, and (C), (E), (G), (I), and (K) to (M) show bin4-1 organs. Bars = 250 μm in (B) and (C), 200 μm in (D) to (G) and (J) to (M), and 100 μm in (H) and (I).

