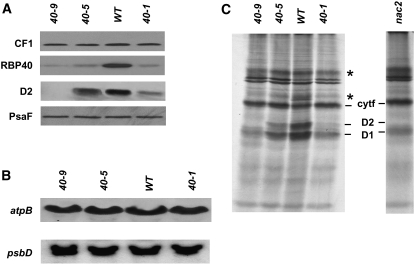
Figure 4.
Molecular Characterization of RBP40 RNAi Lines.
(A) Protein gel blot analysis of total proteins (10 μg) isolated from the indicated RBP40 RNAi lines and the wild type was performed using antibodies raised against the proteins indicated at left.
(B) RNA gel blot analysis of psbD mRNA accumulation in RBP40 RNAi lines.
(C) Total proteins from the indicated strains were pulse-labeled for 20 min with [35S]sulfate and subsequently fractionated by SDS-PAGE. The positions of cytochrome f, D2, and D1 proteins are indicated (Klinkert et al., 2006). Fluctuations of signal intensities marked with asterisks were not seen reproducibly.

