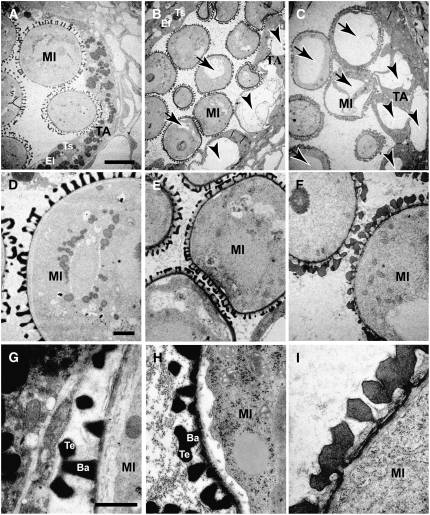
Figure 3.
TEM Analysis of the ms1-1 Mutant and the ProMS1:MS1-SRDX Transgenic Plant Showing Intermediate Sterility.
Microspore and tapetum development in the early bicellular stage is indicated. TA, tapetum; MI, microspore; Ba, bacula; Te, tectum; El, elaioplast (plastid); Ts, tapetosome (lipid body). Arrows and arrowheads indicate vacuoles in microspore and tapetum, respectively. Bars = 10 μm in (A) to (C), 2 μm in (D) to (F), and 1 μm in (G) to (I).
(A), (D), and (G) Ler.
(B), (E), and (H) ProMS1:MS1-SRDX transgenic plant (Col-0 background) showing intermediate sterility. Col-0 control images are not shown here, but the phenotypes are similar to those of Ler.
(C), (F), and (I) ms1-1 mutant (Ler background).

