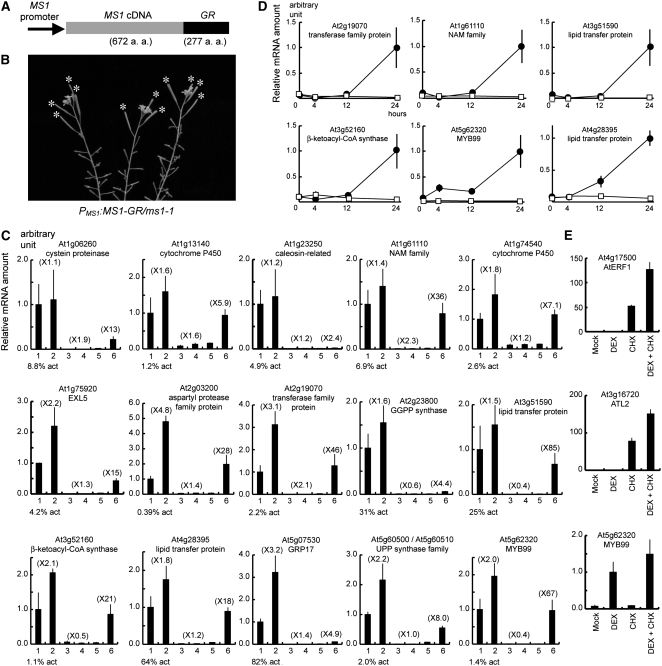
Figure 6.
Search for Immediate Downstream Genes of MS1 Using the DEX-Inducible ProMS1:MS1-GR/ms1-1 Transgenic Plant.
(A) ProMS1:MS1-GR construct. MS1-GR fusion gene was driven by the MS1 promoter.
(B) A 10-d-later ProMS1:MS1-GR/ms1-1 plant in a single addition of DEX on top of inflorescences. Fertility was recovered as shown by asterisks.
(C) Real-time RT-PCR analysis of 15 genes using RNA samples extracted from Ler (lanes 1 and 2), ms1-1 (lanes 3 and 4), or ProMS1:MS1-GR/ms1-1 (lanes 5 and 6) inflorescences 24 h after mock (lanes 1, 3, and 5) or DEX (lanes 2, 4, and 6) treatment. Arabidopsis Genome Initiative code and The Institute for Genomic Research (TIGR) annotation of each gene are indicated. Analyses of other 16 genes are shown in Supplemental Figure 1 online. Vertical axis indicates relative mRNA amount compared with the amount in lane 1. Parenthesis indicates the induction fold compared with the mock treatment. Expression level in lane 1 is indicated as percentage compared with actin mRNA amount (% act). Bars indicate sd.
(D) Time-course induction analysis of the six genes in (C) using real-time RT-PCR. RNA samples were extracted from ProMS1:MS1-GR/ms1-1 inflorescences 0, 4, 12, or 24 h after mock (squares) or DEX (circles) treatment. Vertical axis indicates relative mRNA amount compared with the amount of the plants 24 h after DEX treatment. Horizontal axis indicates hours after the treatment. Bars indicate sd.
(E) Real-time RT-PCR analysis of the At ERF1, ATL2, and MYB99 genes using the ProMS1:MS1-GR/ms1-1 samples 4 h after simultaneous treatment with DEX and CHX. Vertical axis indicates relative mRNA amount compared with the amount in lane 2. Mock (lane 1), DEX (lane 2), CHX (lane 3), and simultaneous treatment with DEX and CHX (lane 4). Bars indicate sd.

