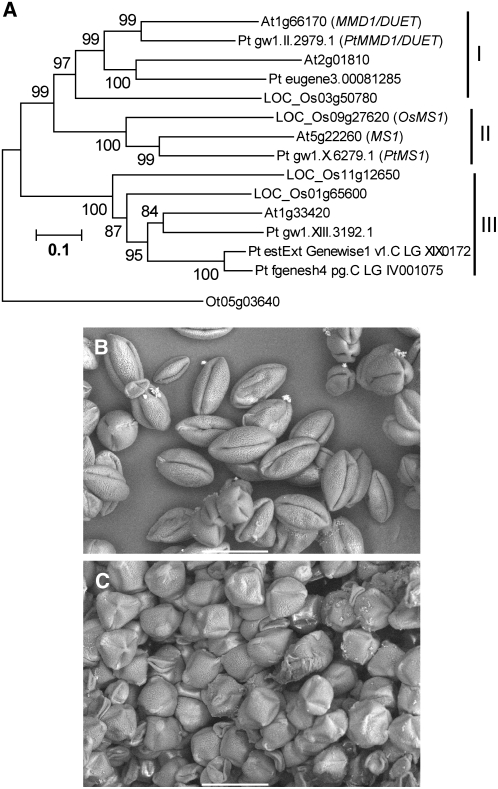
Figure 7.
Analyses of Conserved MS1 Function in Flowering Plants.
(A) A rooted neighbor-joining tree of Arabidopsis, rice, poplar, and Ostreococcus MS1 homologs. An Ostreococcus homolog was selected as an outgroup. Gene identifier numbers starting with At indicate genes from Arabidopsis; names of genes with functional information are given after the identifier numbers. LOC_Os indicates genes from rice (O. sativa), with names given according to gene identifier from TIGR. Pt indicates genes from poplar (P. trichocarpa), with temporary names given according to gene identifier from the Floral Genome Project. Ot indicates a gene from O. tauri. Os MS1, Pt MS1, and Pt MMD1/DUET after the identifier numbers are names of genes with deduced functional information. Bootstrap values are shown near the relevant nodes.
(B) A scanning electron microscopy image of petunia pollen grains transformed with a control vector pBE2113. Bar = 50 μm.
(C) A scanning electron microscopy image of petunia pollen grains transformed with the ProMS1:MS1-SRDX construct. Bar = 50 μm.

