Figure 6.
The Long 3′ UTR of THIC Causes Reduced Gene Expression Independent of Aptamer Function.
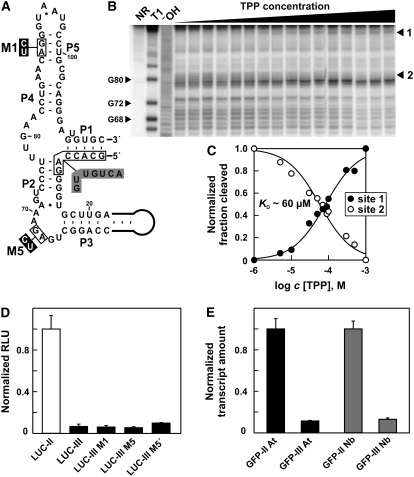
(A) Secondary structure model of the TPP aptamer generated after splicing in THIC type III RNA from Arabidopsis. Gray shaded nucleotides in stems P1 and P2 identify nucleobase changes compared with the original unspliced aptamer. Black boxed nucleotides were altered as shown to generate mutants M1 and M5 that do not bind TPP.
(B) In-line probing analysis of TPP binding by the spliced aptamer depicted in (A). Lanes include RNAs loaded after no reaction (NR), after partial digestion with RNase T1 (T1), or after partial digestion with alkali (−OH). Sites 1 and 2 were quantified to establish the Kd as shown in (C).
(C) Plot indicating the normalized fraction of RNA spontaneously cleaved versus the concentration of TPP for sites 1 and 2 in (B).
(D) In vivo expression analysis of reporter constructs containing the 3′ UTR of Arabidopsis type II or III RNAs fused to the 3′ end of the coding region of firefly luciferase (LUC). Constructs M1 and M5 are based on the 3′ UTR of type III RNAs but contain the mutations shown in (A). LUC-III M5′ contains the inverted 3′ UTR sequence of construct LUC-III M5. Reporter constructs were analyzed in a transient N. benthamiana expression assay and values standardized to a coexpressed luciferase gene from Renilla. Expression was normalized to the fusion construct containing the 3′ UTR of type II RNA. Data shown are mean values of three independent experiments, and the error bars represent sd.
(E) qRT-PCR analysis of EGFP reporter fusions that contain the 3′ UTRs of THIC type II or III RNAs from either Arabidopsis (At) or N. benthamiana (Nb) after expression in a transient expression assay. Expression was standardized to a coexpressed DsRED reporter gene and normalized to the constructs containing a type II 3′ UTR. Data shown are mean values of two representative experiments, and the error bars reflect sd.

