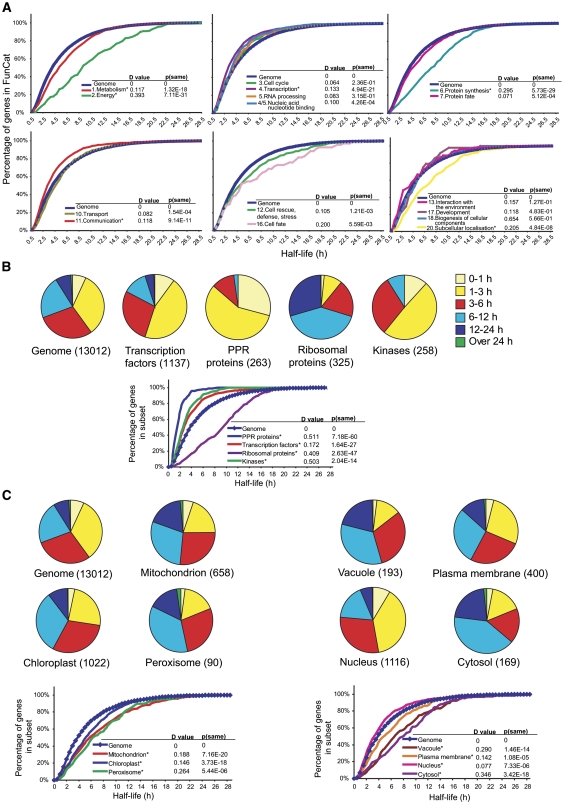
Figure 4.
The Distribution of mRNA Half-Lives of the Whole Genome Compared with Subsets of Transcripts Encoding Proteins within Specific Functional and Localization Categories.
(A) Distribution of the half-lives of transcripts for genes grouped into various functional categories.
(B) Distribution of the half-lives of transcripts for genes encoding transcription factors, PPR proteins, kinases, and ribosomal proteins.
(C) Distribution of the half-lives of transcripts for genes encoding proteins targeted to various subcellular locations. The number of genes in each data set is indicated in parentheses. Significant differences (asterisks) in distributions when compared with the whole-genome set were determined as outlined in Figure 3.

