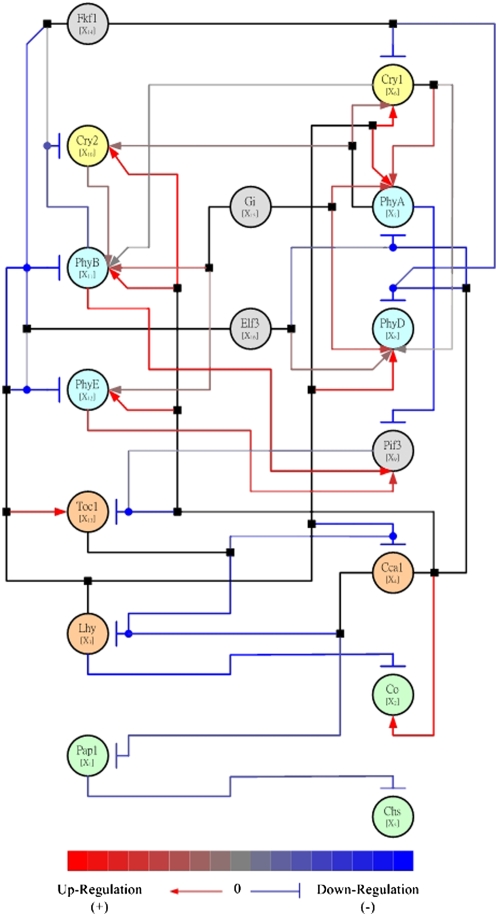
Figure 2.
Illustration of Network Inference: The Predicted Pathway of the Circadian Regulatory System of Arabidopsis According to Chang et al. (2005).
The network nodes (ovals) represent genes and are differentiated by color into cryptochrome (yellow), phytochrome (light blue), clock genes (orange), light-dependent downstream genes (light green), and other relevant genes (gray). The edges (lines) represent inferred causal relationships in a spectrum between activation (red) and repression (blue). Edges corresponding to activation are additionally marked by terminating arrows, and inhibitory edges are marked by terminating blunt segments. Combinatorial regulation is indicated by edge junctions shown as filled squares or circles. A filled square attached to a line indicates where an edge starting from a regulatory node bifurcates to affect several downstream nodes. A filled circle attached to a line indicates the case when several upstream nodes regulate the same target node. Figure reproduced from Chang et al. (2005).

