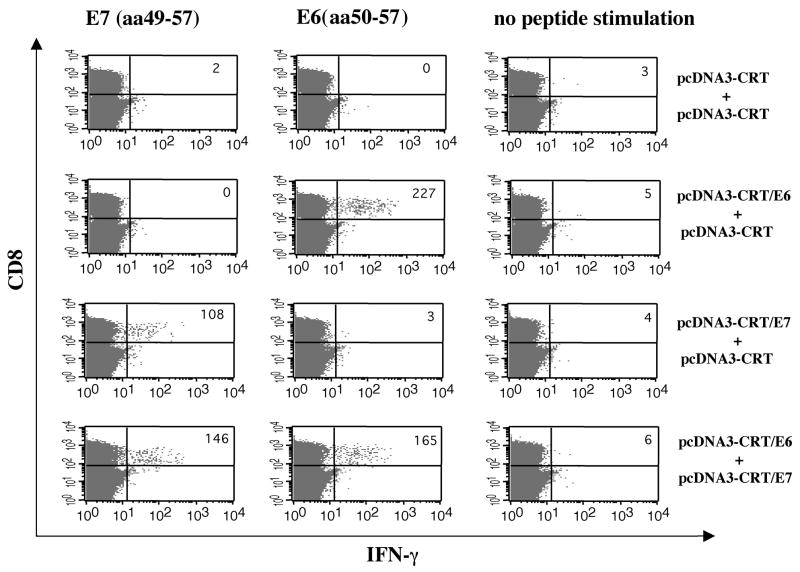
Figure 2. Intracellular cytokine staining followed by flow cytometry analysis to determine E6 or E7-specific IFN-γ-secretingCD8+ T cells in vaccinated mice.
C57BL/6 mice (5 per group) were immunized and boosted intradermally via gene gun with the following vaccination groups: 1) pcDNA3-CRT/E6 (2μg/mouse, right side of the abdomen) and pcDNA3-CRT (2μg/mouse, left side of the abdomen), 2) pcDNA3-CRT/E7 (2μg/mouse, right side of the abdomen) and pcDNA3-CRT (2μg/mouse, left side of the abdomen) or 3) pcDNA3-CRT/E6 (2μg/mouse, right side of the abdomen) and pcDNA3-CRT/E7 (2μg/mouse, left side of the abdomen). Splenocytes were harvested one week after the last vaccination and stimulated with either E7 (aa49-57) or E6 (aa50-57) peptide. Splenocytes without peptide stimulation were used as a negative control. The splenocytes were stained for both CD8 and intracellular IFN-γ. The numbers on the right upper corner represent the number E7-specific IFN-γ-secreting CD8+ T cells per 3×10⁵ splenocytes acquired. The data presented in this figure are from one representative experiment of two performed.

