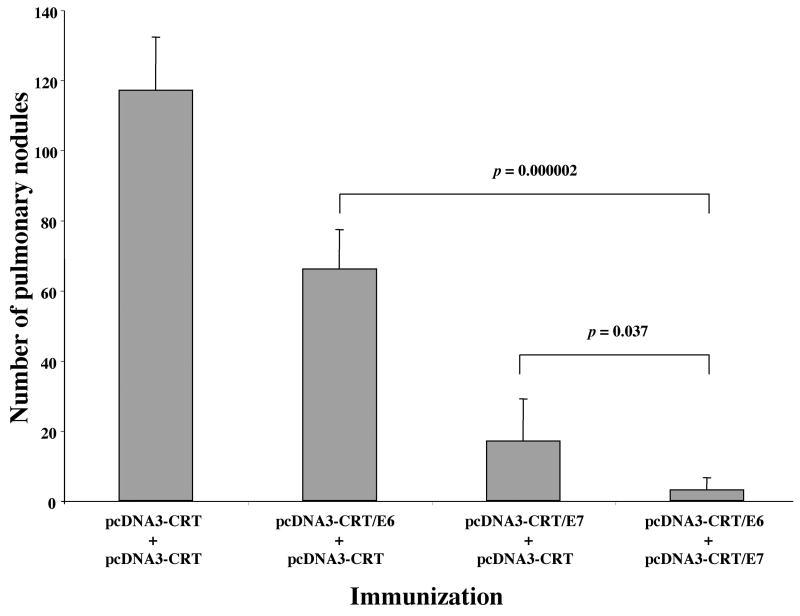
Figure 3. In vivo tumor treatment experiment to compare the antitumor effect generated by various vaccination groups in mice.
C57BL/6 mice (5 per group) were challenged with 1×10⁵ TC-1 tumor cells via tail vein injection. Three days later, the mice were immunized and boosted as described in the Materials and Methods section. Twenty one days after tumor challenge, the mice were sacrificed, and the lung tumor nodules were counted. The data are expressed as mean number of lung nodules ±S.D. The data shown represent one experiment of two performed.

